KAVA Long idea In the ever-evolving realm of cryptocurrency, where fortunes flicker like distant stars, Kava emerges once again, inviting traders on a fresh journey of potential gains and exhilarating market maneuvers.
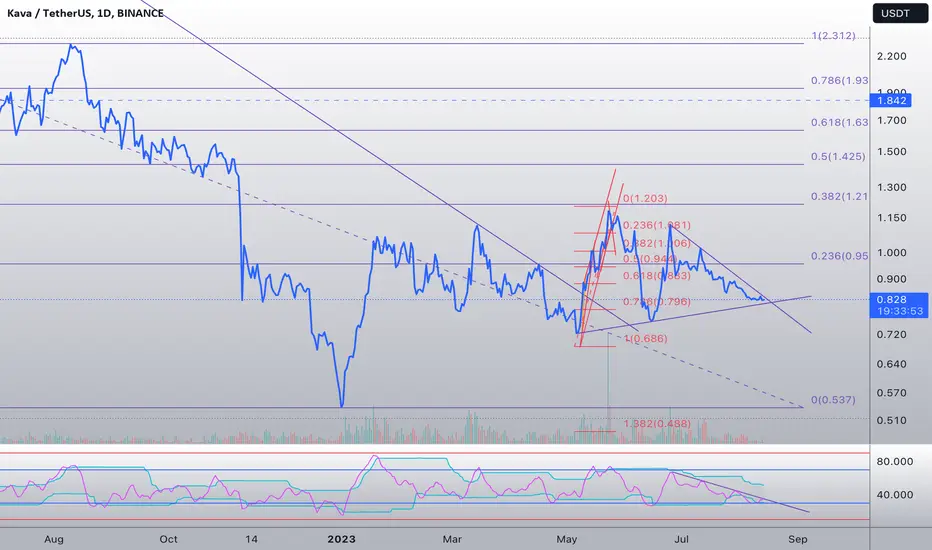
Picture the chart, a line of time etched with the memories of past movements. A channel, like a road leading to possibilities, draws our attention. It’s not just an ordinary channel, but a path that has proven its significance in the dance of prices. This channel, like an old friend, has seen the rise and fall of trends, and now, it beckons us once more.
Step back for a moment and ponder the Stochastic indicator, that little oscillating wonder. It's in a state of rejuvenation, its readings bottomed out. It’s as if the market's heartbeat has found its rhythm, preparing for a new pulse.
As we study this chart, the Fibonacci 0.786 level glows like a beacon. A level where altcoins seem to whisper secrets, it's a place of interest, often a playground for significant actions. Just as Fibonacci numbers spiral through nature, they spiral through these markets, guiding us.
But there's more to the story. Imagine the On-Balance Volume (OBV), a silent observer of market movements. Divergence, like a symphony of intrigue, plays its tune. It’s as if the market is telling us a story, a narrative of potential. It's this divergence that piques our interest, suggesting that hidden possibilities might be unfolding.
And then there's volume, the voice of the market, its fluctuations as significant as a conductor's baton. For this swing to work its magic, the crescendo of volume needs to accompany the upward movement. It's the signal that turns a solitary move into a symphony of momentum.
This tale, my friends, is not just a glimpse into a crystal ball. It's a calculated dance of data, a thoughtful strategy that beckons you to seize the potential while protecting your capital. As we embark on another swing long trade, armed with knowledge and insight, we brace ourselves for the next chapter. The markets shift, the numbers change, but the essence of trading remains.
As Kava extends its invitation, it's time to write the next verse in the saga of potential gains. Gather your wits, adjust your strategies, and let the journey continue. Set your stop-loss, a safeguard against unforeseen tides, below the 0.7815 mark. It's a strategic move to protect your capital, even amidst the allure of profit.
So let the path be navigated with both caution and courage, for risks are managed, and the potential for gains remains.
KAVAUSDT trade ideas

KAVA- Are you ready?Dear my friends,
Not much to say about Kava! Breaking is only a matter of time.
Patience and waiting are key.
Best Regard,
KAVAUSDTNot an investment recommendation. This chart was made for personal study and personal use only. If you liked the idea, please like it. If not, write why. In my humble opinion, the price will go up.

KAVAUSDTHello traders
I've updated KAVA chart.
The old chart was in 4H timeframe and this one is daily.
I attach previous chart in bottom of this chart.
After drawing chart I remove INDICATORES I don't analyze without indicators.
KAVAUSDTThe price is in the middle of the long-term channel as well as the bottom of the daily time frame trend. The first target is 15%, the second target is 35%

KAVAUSDT LONG POSITIONas you can see we have a FALLING WEDGE and also DIVERGENCE in RSI
FOLLOW AND SUPPORT FOR MORE ANALAYSES

KAVA TO 1.6$ Short term The current analysis indicates that KAVA is currently exhibiting a macro fib channel pattern. A historical pattern has been observed wherein, upon reaching the defined gray area at 0.508, the price has experienced a substantial rebound. Based on this historical precedent, there is an anticipation of a similar price rebound from the aforementioned level.
Consequently, our recommended target prices (TPs) for this potential price movement are as follows:
1. The first target is set at $0.97, representing 23.6% of the fib channel range.
2. The second target is established at $1.28, reflecting 61.80% of the fib channel range.
3. The third target stands at $1.6, equivalent to 100% of the fib channel range.
These target levels have been determined by carefully evaluating the Fibonacci retracement levels, and they align with historical price behavior and key technical analysis principles. It is important to note that these targets are based on observed patterns and historical data, and as such, it is recommended to continually monitor market conditions and adjust strategies accordingly.

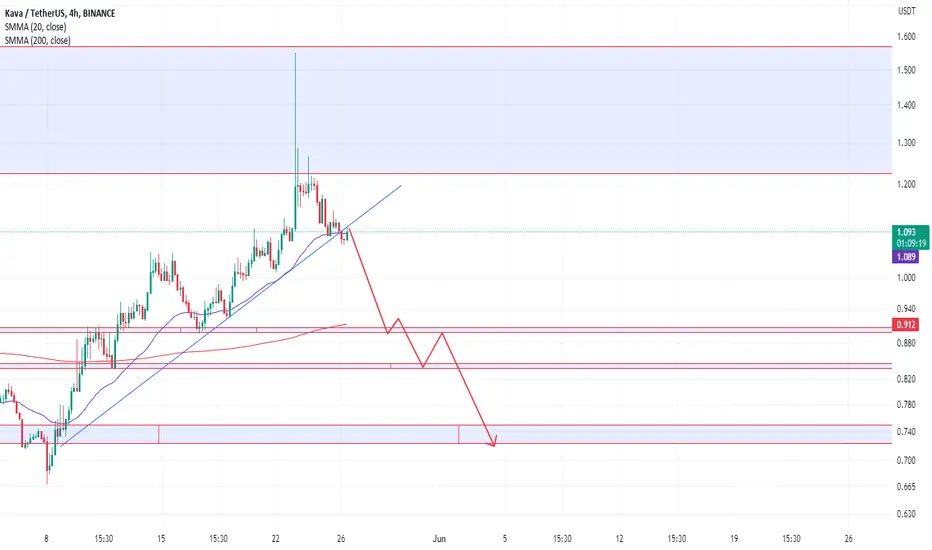
Kava long tradeparallel channel ascending on the daily.descending bullish parallel channel on the 4h tf . trend based fibs confluence with 0.886 so assuming at that level will be the breakout from the descending parallel channel and bouncing from the daily ascending parallel channel

KAVAUSDTHello Traders,
we can expect a big bullish movment from KAVAUSDT as w can see that it is on the proper support and making triangle wait for the breakout then open a positions.

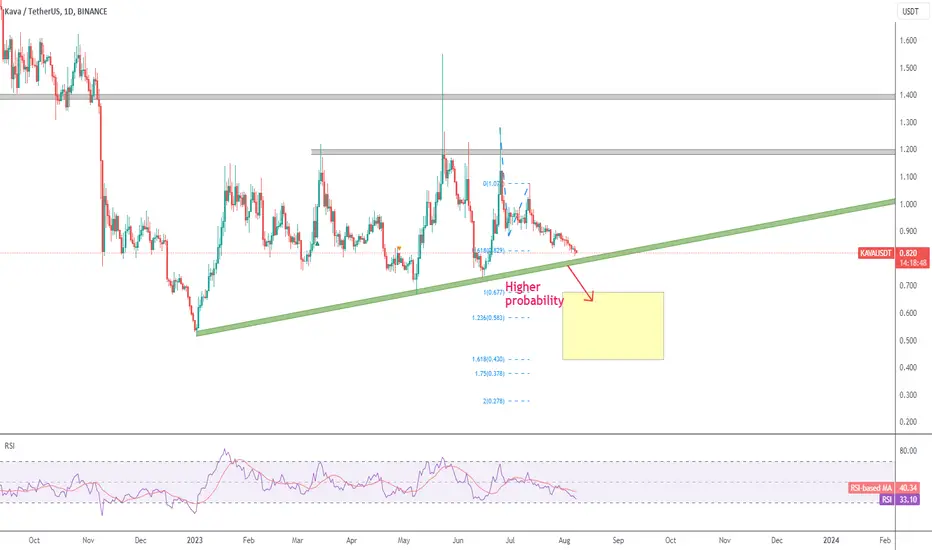
KAVA - Higher probability of a breakdown
Kava has consistently faced rejection in all its attempts at an upward breakout, whether at the 1.2 or 1.4 resistance levels.
While the ascending green trendline could provide temporary price support, the prevailing probability points towards its eventual breach, initially aiming for 0.677.
There are currently no signs within the price action to consider a long position.
KAVAUSDTHello Traders,
The current condition of the KAVAUSDT pair at its 4-hour support
you can long position.
but has not bounced back or retested the area.
there is potential to make a falling wedge but a lot of noise for this pair
Please add a comment and Positive feedback and
constructive criticism are important to authors and the
community.


KAVAUSDTHello. We have a chance to go up with Bitcoin. Yes, this is a small rebound, but the potential is good.

KAVAUSDT LONG/SHORT Just a simple Idead As the BTC is Playing tricks Some Alts Says i will Pump
One among is KAVA
JUST DO the RIGHT research B4 investing
These are my Small ideas... i am a Noob ... i have only 5 yrs on these ...
NAFA n DYOR
My chart will be simple... I don't have access to Pro indicators... it will be simple
Thank You

KAVAUSDT - are you ready for the rally?We just went long on KAVA since the price is trading near the 61.8% Fiboinacci support. The risk/reward setup is decent and probability favors the uptrend. Let's get rolling KAVA~!

#KAVA long#KAVA having a strong support we can see a nice move from here upto 10%. hold it tight cheers!
KAVA/USDT 1DWe are in a very important support range and this range is exactly the 0.618 Fibonacci range. We have seen price rejections from this range in the past, the downward trend is weakening and if this area is not lost, we can expect support from this range.

#KAVAUSDT #LQR #TOBTC #LaqiraProtocolDue to the bearish strong of candles . there is a possibility of further correction in the specified support zone of the fib cross and static levels. you can open a trade after confirming and matching the bitcoin levels. This analysis is not an offer to buy or sell


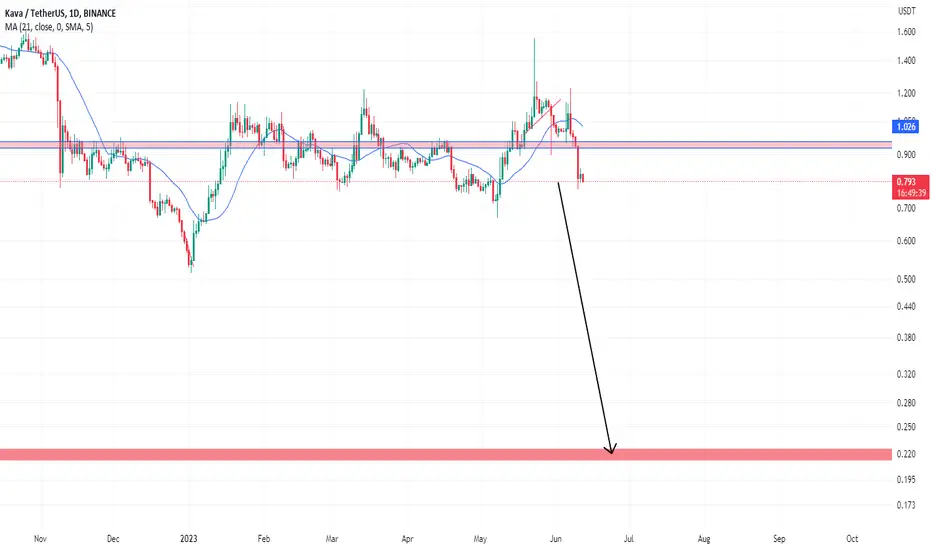
Brief Analysis —— KAVARecently, cross-chain bridges such as Multichain and PolyNetwork have been attacked, causing losses of millions of dollars. As a protocol that connects the liquidity of different chains, it is particularly important for the crypto industry. Today we will take attention on FTM/USDT, MULTI/USDT and KAVA/USDT, which affected by the attack of Multichain.
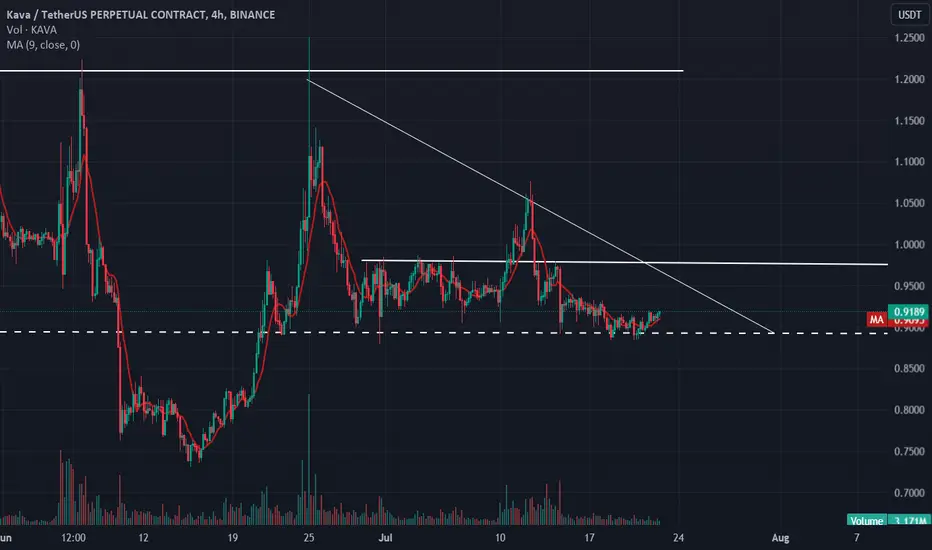
Although it is not obvious, you can still find that KAVA has been fluctuating within a range since January. The price returns quickly after breaking out of the range. In the short term, the range has narrowed since late June and enlarged on Jul.10. Two long green candles pushed the price to the upper rail of the black angle with increased trading volume, but the bears strengthened, and two red candles kept the price back to the range of the previous few days.
Conclusion: The high probability decline has not ended. Different from the bulls rising after the fluctuation, the bears strengthened after the bulls strengthened, forming a V-shaped reversal with the same slope. Bears have the lead. Volatility increased and the price is approaching the lower rail of the angle. We think that the price has a high probability of falling and breaking through the lower rail of angle. But on a large scale, we believe that the original range will still be followed. We maintain the resistance level at 1.2 and the support level at 0.72, which is the previous range.
If you have any ideas, welcome to communicate with us:)
Disclaimer: Nothing in the script constitutes investment advice. The script objectively expounded the market situation and should not be construed as an offer to sell or an invitation to buy any cryptocurrencies.
Any decisions made based on the information contained in the script are your sole responsibility. Any investments made or to be made shall be with your independent analyses based on your financial situation and objectives.

kava buyBINANCE:KAVAUSDT has reached to his trend line now and we expect that this coin will pump from here. lets take it with r r 4

KAVA price where are you going?Today, KAVA will update its network. And almost at the same time, the announcement of the "fresh" US CPI.
If the two news turn out to be positive, this could be a c-c-combo push for the KAVAUSDT price to move up.
The critical level is $1.20. From this level, the price may begin to rise:
rapid growth along the $1.50-2.30 route
and a correction to $0.80
_____________________
Did you like our analysis? Leave a comment, like, and follow to get more
