KMD rising wedge / H&S?might bewrong but selling 25% and loading up more KMD between 10K and 13K sats before moon.
KMDBTC trade ideas


Lot of work need to be done to remain bullishStrong resistance zone at 13500 -14000 sats. Daily 25 EMA is at 13500 sats.
Daily RSI bullish, Volume is good even after sell off which shows buying interest. I will consider buying if it breaks above the levels mentioned.

$KMD, Pushing against 13.5k sats resistance once again$KMD / $BTC Pushing against 13.5k sats resistance once again (acumulation under resistance )..
If crossed, we can aim again for a 16.7k sats as first target/zone of trouble..
Volume has been very good over the last week..
UCTS Buy signal on the 4H
MACD bullcrossed
#KMD


$KMD Rebrand Coming July 15th - BTC Lower VolatilityWith less $BTC Volatility and a full re-brand coming for Komodo, the next couple days are looking great for $KMD.
$KMD will introduce Antara Smart Chains & a full re-brand on July 15th. The re-brand was initially planned for end of Q4 2018, but was pushed back to ensure it was completed properly.
Longterm levels drawn using the 1W. I'm expecting a test of upper side of the wedge (18500 - 19000 sats).

KMD 25% PROFITHCH + Pullback en la zona del buello para tener una entrada hasta zona de venta, para obtener un 25% de profit

KMD attempting a bullish breakoutKMD created a nice head and shoulders pattern which seems to provide enough momentum for it to breakout. KMD was also one of little alts that had sustained or even gained on btc while it went though a bigger selloff


$KMD This setup looks really good..$KMD This setup looks really good as rebrand on July 15th is coming..
Flipping resistance into support at 13.5k sats level
Volume flowing in over the last days (Volume preceeds price)
RSI entering overbought
HL & HH sequence since end June bottom
UCTS Buy signal on the 6H
#KMD

KMDBTC double cup and handleKMDBTC cup and handle after the rH&S we watch and see. if broke 1400 sats STOP and wait rebuy.


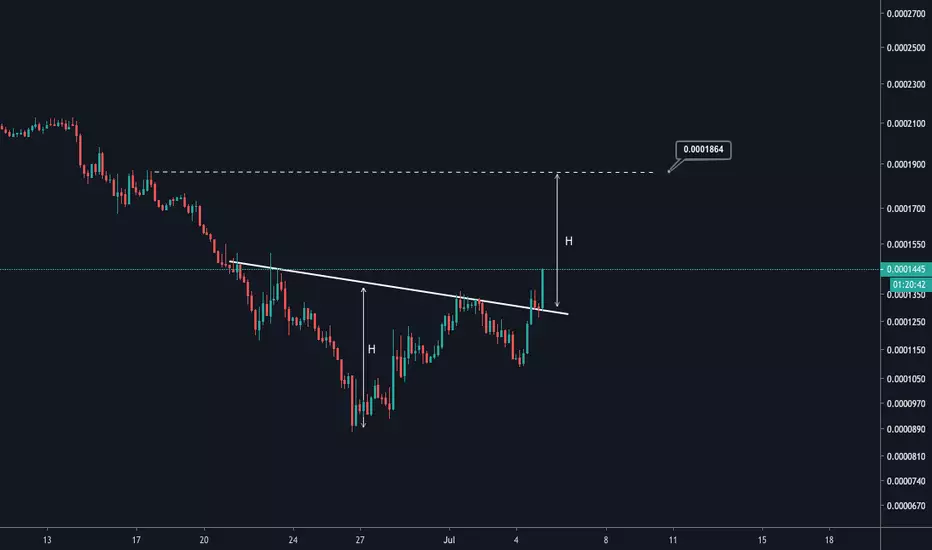
KmdBtc trade opportunity with 200% profit targethello friend, spotted potential downtrend channel with price forming a falling wedge like pattern in between. With the price already hitting the bottom level of the pattern. I expect a major rise from here.
Kindly follow the suggested accumulation zone on the chart and always remember to apply stop loss according to your risk mitigation.
Level to watch for are:
POSSIBLE ENTRY ZONE
Possible Support LEVEL
SELL TARGETS
Do know that I appreciate your effort and the time spend in reading and watching my posts and Please leave a LIKE and FOLLOW us for more updates.
Thank you
Note:
It will be good to always understand risk involve in trading. Always trade with stop Loss in place.
Set up an entry/exit strategy for every trade, with good risk/reward ratio.


Komodo Prepares For Bullish Action, 187% to 710% Profits PotentiKomodo (KMDBTC) closed last week with a bullish Doji, which is marked with a purple circle.
We can also notice from the chart above how KMDBTC touched the support level back from March 2017. We can also see that a strong bullish wave followed the bounce from this support.
We can notice bullish divergence on the MACD, with strong hidden bullish divergence on the RSI.
Important resistance levels (targets) are marked on the chart with grey and blue/orange dashed lines.
Conditions for change: Komodo (KMDBTC) is highly bullish after last weekly candle close, but, if KMDBTC moves down and closes below 0.00009000, the above signals become invalidated and KMDBTC con continue going lower and test the next support.
Anything above this level and we remain bullish.
Thanks a lot for reading... Feel free to hit like to show your support.
This is Alan Masters.
Namaste.
Previous Komodo (KMDBTC) analysis:
----------------
THIS IS NOT FINANCIAL ADVICE.


KMD printed strong weekly doji 282% profit. Decent volume Komodo is showing underlying strength on the weekly chart.
1. Buyer printed a strong doji candle, which is an good indicator for a reversal
2. Volume is slowly but steady increasing since October 2018 with some decent green spikes
3. RSI low was August 2018 and is crawling its way up 50.0 threshold where it has been rejected last time about 2 weeks ago
We see the price fall slowed down and buyer made a strong doji. All in all it seems KMD is heading up to 2270. A retrace is expected.\u2028
What do guy and girls say? Did I miss anything?

$KMD Bouncing from ATL BTC support at 9K sats..$KMD UCTS Buy signal on the 6h following the bounce from the ATL BTC support at ~9k sats...
If it manages to keeps pushing up, next target should be at 13k sats for a 18% movement from current level...
RSI started to rise from oversold levels and MACD bullcrossed.
#KMD

