KMDBTC trade ideas

$KMD - LONG - 4HR- Triangle with descending volume looking to break out
- ran stops below support and now coming back over
- could target previous highs but trying to be conservative and lock profits

[KMD/BTC] REVERSAL COULD START HERE [100-200% POTENTIAL PROFIT]#KMD / BTC ( Binance, Bittrex )
Buy Range : 0.00017-18
Stop Loss : Not recommend
Target 1 : 0.000286
Target 2 : 0.00037
Target 3 : 0.00049
WEEKLY CHART
- RSI near oversold zone ( Positive )
- MACD turning from very negative zone to negative ( positive )
- Downtrend trendline not broken yet ( Negative )
- Moving averages above candle ( negative )
DAILY CHART
- RSI has turned from downtrend pattern to uptrend ( positive )
- If daily candle closes above EMA20 it will be a good signal ( positive )
- Double bottom spotted at 15.7k sats ( positive )
- MACD showing some good action ( Positive )
- Ichimoku cloud still above candles ( negative )
- Main descending trendline remains ( negative )
4H CHART
- EMA20 and MA50 crossed and below candles ( positive )
- MA200 has been broken and retested giving some support for now ( positive )
- Ichimoku cloud has been broken and candles stay above it ( positive )
- RSI shows overbought acton , which need to reset before continue up ( neutral )
CONCLUSION
KMD is a very nice coin which got lot of potential.
On the short timeframes its looking good as other altcoins. It can be bought on pullbacks or when trendline get broken and retested if you want a safe entry.
I think this coin could reach higher positions if market turns to bull, so, i wil be updating as other ones if we reach our targets.
Good luck

$KMD Potential bullish flag as continuation of the trend...
UCTS buy signal active on the daily
MACD & RSI flat, deciding (⏳)
Volume looks low for now
While the ascending trendline hodls we can expect further up movements for the asset.
#KMD

SoT 2.0 Chartoff Submission Week 3 KMD/BTCKMD/BTC looks poised for a breakout demonstrated by the following criteria:
-Upward Laddering has started on the 1 hour time frame
-Likely to hold support on a Daily Level from the past
-Daily Trends are coming to an intersecting point on the Daily support level creating a wedge to be broken
I have decided to take entry if a accumulation occurs on the long standing Daily Level from the past. I am waiting to see if this support holds closer to the Daily Down Trend before taking entry to reduce risk then holding for the break of that level. Breakout should occur before March 21st 10:00am. To reduce risk I would potentially use the daily uptrend as a stop if the move goes sideways through Trend which would indicate move failure.

KMD Potential Cup & HandleKMDBTC has had MASSIVE volume on Binance.
Chart is on Bittrex for a better history of it.
A move to resistance at 45k or so could be the makings of a beautiful cup and handle.
A break below 22k sats will cause it to potentially fall back to sub 20k.
This is a long term bag for me, will be accumulating for a while.


$KMD Showed highest trade volume in Binance history$KMD Showed highest trade volume in Binance history, confirming the switch as resistance-->support of the ~2277sats level.
Currently some retrace (RSI bearish divergence) after the 60%+ Candle can be expected
Entry close to the green box seems a good option for future trades #KMD


KMD could be ready for a breakout! KMD looking ready to pop but looking for a pullback first before entry!
Thanks guys!

KMD longMarkup phase for KMD, healthy accumulation, broke out of trading range and found support. Golden cross. wonderful


Incoming pullback?$KMD 50% run over the last 2 weeks, right now its starting to show signals of an incoming pullback at least to retest gained levels.
Both MACD & RSI showing bearish divergences.
Volume slowly decreasing & a potential ascending wedge could at play.
stay alert... lock profits! #KMD

KMDBTC Looking 1 Week holdKMD 1 Week Hold Buy Range 2350-2390. Targets Open to 3000 Sats Area. Stop Loss 4%. To potentially gain 20+%


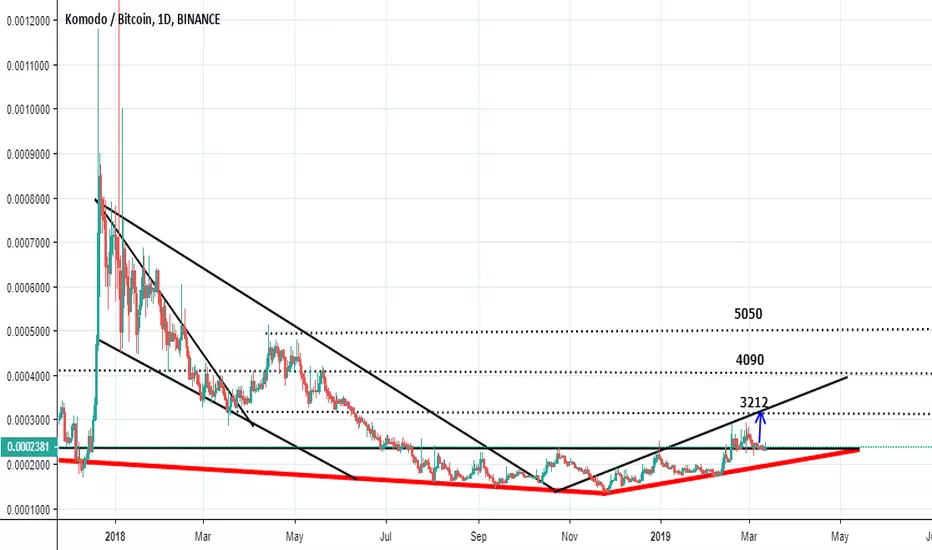
There is a possibility for the beginning of an uptrend in KMDBTCTechnical analysis:
. KOMODO/BITCOIN is in a range bound and the beginning of uptrend is expected.
. The price is below the 21-Day WEMA which acts as a dynamic resistance.
. The RSI is at 50.
Trading suggestion:
. There is a possibility of temporary retracement to suggested support zone (0.00017400 to 0.00015600). if so, traders can set orders based on Price Action and expect to reach short-term targets.
Beginning of entry zone (0.00017400)
Ending of entry zone (0.00015600)
Entry signal:
Signal to enter the market occurs when the price comes to " Buy zone " then forms one of the reversal patterns, whether " Bullish Engulfing ", " Hammer " or " Valley " in other words,
NO entry signal when the price comes to the zone BUT after any of the reversal patterns is formed in the zone.
To learn more about " Entry signal " and the special version of our " Price Action " strategy FOLLOW our lessons:
Take Profits:
TP1= @ 0.000196
TP2= @ 0.000223
TP3= @ 0.000278
TP4= @ 0.000312
TP5= @ 0.000423
TP6= @ 0.000512
TP7= @ 0.000601
TP8= @ 0.000728
TP9= @ 0.000880
TP10= Free
