Alt coin shills baby one of my other FAV Almost every alt is bottomed and if BTC decide to run off the cliff I have the next floor plan to play either way IM NOT SELLING GO CRYPTO good luck !
KMDBTC trade ideas

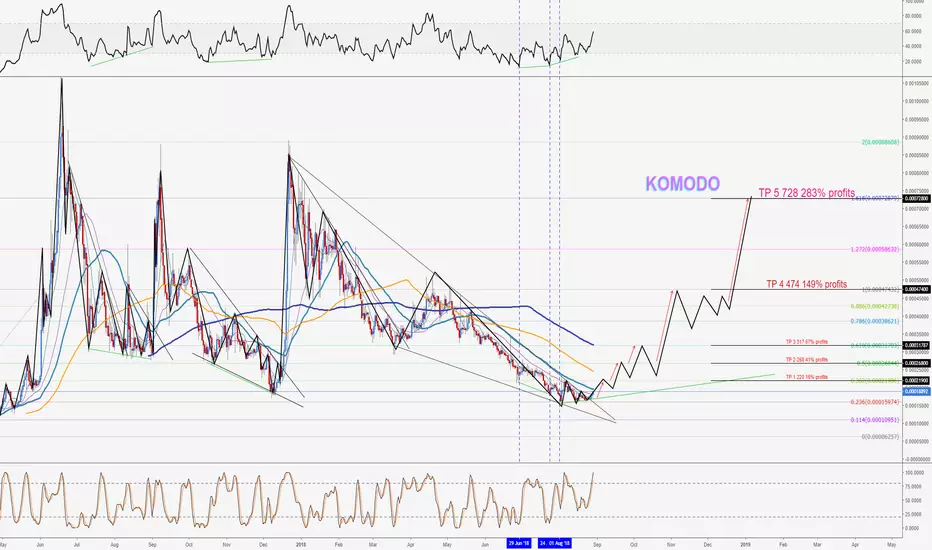
[KMDBTC] Komodo Before The Action [500% PP]Komodo (KMDBTC) is showing many of the signals that we have been spotting on the other altcoins charts. We have patterns and formations showing us that a huge down wave has been completed, and an up wave is on its way.
Komodo (KMD) by Alan Masters Trades
- We have a bullish crossover on the MACD.
- Indicators curving up. STOCH and RSI coming out of oversold with a reversal candle (Doji) when the lowest point was hit on 10th September.
- The daily candle show signals where KMDBTC is trying to breakout.
- Volume is yet to build up. Action yet to start.
- Great potential to catch the action before it starts.
- Available on both Binance and Bittrex to trade plus many other exchanges.
Trade instructions by Alan Masters Trades
Buy in: 0.000170 – 0.000183
Next support: 0.000153 – 0.000163
Note: “Next support” is equivalent to a second entry point.
Targets KMDBTC by Alan Masters:
(1) 0.000207
(2) 0.000224
(3) 0.000258
(4) 0.000280
(5) 0.000312
Stop loss: Close below 0.000144 on the weekly candle.
THE NEW JOURNEY STARTS
Engines ready, heart on top of my head.
The new journey starts, I am ready to launch ahead.
Clouds won’t stop me, I can even enjoy the rain.
Bring in the work…
I am ready…
My new journey starts today.
Namaste.

There is a possibility for the beginning of an uptrend in KMDBTCTechnical analysis:
. KOMODO/BITCOIN is in a range bound and the beginning of uptrend is expected.
. The price is above the 21-Day WEMA which acts as a dynamic support.
. The RSI is at 55.
. The RSI downtrend & The price downtrend in the daily chart are broken, so the probability of the resumption of an uptrend is increased.
Trading suggestion:
. There is a possibility of temporary retracement to suggested support zone (0.000170 to 0.000156). if so, traders can set orders based on Price Action and expect to reach short-term targets.
Beginning of entry zone (0.000170)
Ending of entry zone (0.000156)
Entry signal:
Signal to enter the market occurs when the price comes to "Buy zone" then forms one of the reversal patterns, whether "Bullish Engulfing" , "Hammer" or "Valley" in other words,
NO entry signal when the price comes to the zone BUT after any of the reversal patterns is formed in the zone.
To learn more about "Entry signal" and the special version of our "Price Action" strategy FOLLOW our lessons:
Take Profits:
TP1= @ 0.000188
TP2= @ 0.000223
TP3= @ 0.000278
TP4= @ 0.000329
TP5= @ 0.000415
TP6= @ 0.000523
TP7= @ 0.000643
TP8= @ 0.000880
TP9= Free


KMD Hits targetGreat entry for KMD and we just smashed through TARGET 1.. Taking profits at the right time is key to succeeding in Krypto trading

KMD/BTC3 Reasons for trade setup:
Location: At support lows
Momentum: W confimred in Willy n OBV. Bullsih divergence confirmed. Lets see if we can keep it up.
Structure: Double bottom confirmed.
Profit Objective 2:1 R/R min, looking to tag the 50% retracements. The first one being at 0.0002002 BTC and the other at 0.0003279 BTC. Sell partial positions once targets have been reached.


Komodo floppin around like a fishInteresting point in Komodo right now, it's not financial advice just interesting


$KMD, 93% OFF…
Weekly
Looking at our trend timeframe we see price has formed a lower high at 19000, and is now looking for a lower low near our dynamic and horizontal support at 7000 satoshis. Stochastic RSI showing momentum remains in favor of bears with no signs of reversal.
Daily
Shifting over to or pattern timeframe we see price has found support at 15000, stochastic rsi showing momentum in favor of bears. A daily close above 16200 activates our trade, however if rejected at this level expect a sell off towards 12000 support. Expecting price to fall towards our historic lows at 7000.

#KMD KOMODO Long Term Idea ( #bittrex #binance $kmd)#KMD in accumulation zone, oversold, uptrend is expected. Great time to buy and HODL.
Good Luck!
Crypto Guide Team

KMD accumulation rangeKomodo sitting at the bottom of a 1.5 month accumulation range
Upcoming rebrand (end of september) should be the catalyst to break the trendline
Stop losses at 14500 sats

Analytics KMD/BTCThis asset is characterized by very low liquidity, the daily turnover, on average, is 50 BTC. After the fall, which lasted from May to August, the historic minimum of 0.00017 was broken, after that the coin went into a sideways trend.
At the moment, a strong support level is 0.0001541. This asset shows that it descends after the market, but does not grow behind it. The rate can reach 0, 00024 if a stable upward trend will appear, and the price will break 0.00020. After this it is necessary to conduct additional analysis. In DOM we see that the coins are being purchased, but by single and large volumes relative to the daily turnover.
When investing, pay special attention to low liquidity and the potential for manipulation consequently.

KMD | Still Bearish
• As long as there are no weekly closes above 0.0001878, there is no reason to enter technically.
• Fundamentally KMD is a strong project but is still in negative price discovery so you're much better off buying a confirmed reversal on a retest.

KMDBTC retracement movementThe price broken down through the strongest support, however it seems that market players do not want to trade this coin at the lower price. Indicators become bullish, EMA 20 is going to intersect the rest EMA lines while there is hidden bullish divergence and Gartley butterfly.
The price will pump back to the Fib 1 retracement level and then it will be possible to scalp using our targets. Stay tuned for updates


Komodo is looking bullish with a minimum of 50% uptrendMACD cross, rising RSI, a Wix Pix signal and favorable trendlines are making Komodo look bullish to me.

will kmd moon? actually I'm not sure, but hopefullywill kmd moon? actually I'm not sure, but hopefully

KOMODO vs. Bitcoin [KMDBTC]Crazy cycles in Komodo chart, lets ride!
Stop loss under 150
RSI bullish divergence shows us good opportunity to buy
Old support, new resistance?Looks like that old support has turned into new resistance. I'm going to wait and see where this goes before making any moves. If it can break past the resistance around 0.000225 then I may enter a position.
