KMDBTC trade ideas


LONG KMD/BTCStrong support is getting touched and a nice risk/reward trade is possible here.
Let me know if you've got feedback! Always eager to learn!
Thank you.

KMD/BTC | Key Level | Range Support | Trade Setup Today's chart – KMD BTC – consolidating at range/structural support. Price holding support validates a long trade to technical targets above.
Points to consider:
- Key level
- 21 EMA visual guide
- Oscillators oversold
Trading at its long-term range support; proceeding a stark correction. Price needs to hold support to form a bullish bias.
Further price action and trend continuation will allow the 21 EMA to act as a visual guide; a trade management tool assisting in defining risk. An S/R flip of the 21 EMA will further support the bullish bias.
The RSI is trading near oversold conditions indicating weakness in the immediate market. Stochastics are reaching oversold conditions and may remain oversold for some time, however, a valid buy cross will indicate momentum shifting on the macro time frame with stored momentum to the upside.
Overall, in my opinion, KMDBTC needs to hold support at this level for a long trade to technical targets above and risk defined below support.
What are your thoughts?
If you’ve read this far - thank you for following my work!
And as always,
Focus on you, and the money will too!

KMD/BTC (3rd Retest Key Support?)KMD/BTC
-The key support at 520 range is about to retest for the 3rd time
-If that level will hold for at least 5-10 days
-There is a high chance of potential bounce reaction up to 700 sat range
-Bearish scenario, a close below the key green support area
-Will send the price to ATL and new price discovery

Komodo, KMDBTC, 2020 Range playAnother simple S & R chart showing important 2020 price points in KMDBTC. Buying at the bottom of the range has proven to be an easy way to stack sats all year.

KMD/BTC is in a BIG BULLISH TRIANGLE!!KMD/BTC is in a BIG BULLISH TRIANGLE!!
There is also news coming up:
Komodo (KMD)
30 September 2020
LibnSPV Upgrade
A good entry would be inside the green target if there is a pullback or retest of the lower trend line of the triangle..
This may be a mid term hold - give it a month or two.
Please keep an eye on BTC, an irrational move from Bitcoin could change this chart dramatically.
Trade safe my friends....
BINANCE:KMDBTC


KMDBTC: Falling wedgeFalling wedge
Finds a long time in accumulation
1 - 0.0000774
2 - 0.0000871
3 - 0.0001040
4 - 0.0001200
5 - 0.0001380
f you like what I do, put 👍 and subscribe
Waiting for your comment, what do you think about this?


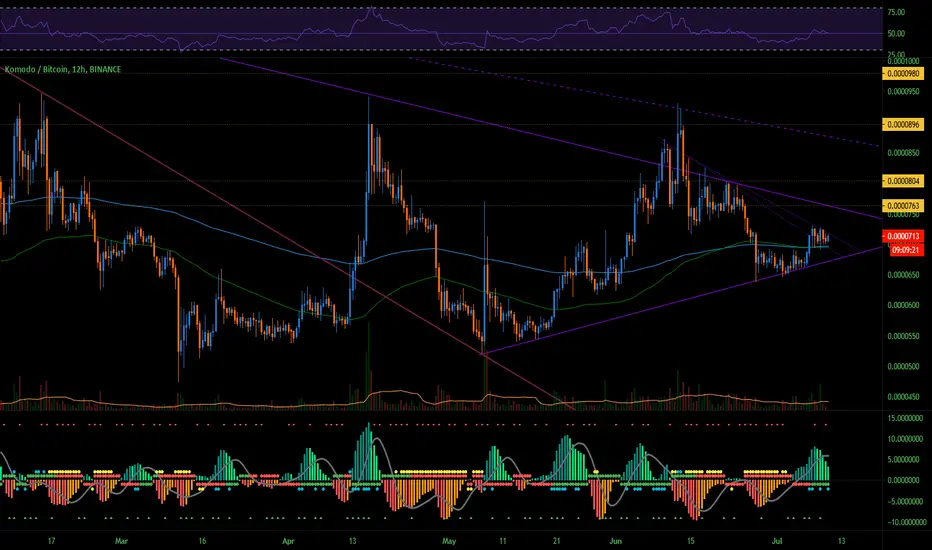
KMDBTC UpdateSame lines as before. Showing strength in the uptrend. Flipped the first major diagonal on the 12hr chart - still pending on the daily.
RSI looking good. I'd expect this to continue building up over the next week or so. It seems KMD will go off once the time is right.


KMD Weekly Breakout Setup1 Day price trying to break 200 EMA
Buy Below 740 and hold this is weekly breakout Guys
Stop : 650
Target : 800 , 950 , 1100 , 1300

KMD BREAKOUT PLAY [FALLING WEDGE]Falling wedge, play the breakout ONLY. Measured move is 11k sats.
MACD diverging bullishly.
Stop: 500 sats

Komodo looks bullish next weekTrend seems to be bullish as the candles are making higher lows. Also the weekly resistance had been broken as well as it has been tested and rejected, which shows the 622 is a strong support. KMD is going to test the monthly resistance at 809 and may wick above upto 957 level which has been test 3 times before. Third confirmation is that the trend lines are being respected.
716 is the support on the trend line as KMD also broke the trend line. This red weekly candle with a wick below is the first test of the newly made support.
In coming weeks we may see 10 to 15 percent increase, we can wick past that as well upto 957 which would be a 25 percent increase.
I usually dont use indicators, More of a Price Action lover. Indicators like MACD, RSI are great. Gonna use in coming charts.
Trade safe, dont invest your 100 percent in one asset.
Good luck.

KMD/BTC (Potential Weekly Higher Low?)KMD/BTC
-this coin has been on a sideways market since August 2019
-the channel is ranging between 500-800 sat
-there is also a clear mid resistance at 800 sat
-if this level can be cleared out
-it will be a buy signal on breakout or retest of new support
-upside potential is up to 1300 sat

Nice Head and Shoulders forming at KMD/BTCA clear Head and Shoulders is forming, causing a great LONG oppertunity.
The strong support and resistence are very clear as well and could be used as stop/loss indicators.
Let me know if you've got feedback! Always eager to learn!
Thank you.

KMDBTC looking for a breakout 🦐KMDBTC looking for a breakout
According to Plancton's strategy, we can set a nice order
–––––
Follow the Shrimp 🦐
Here is the Plancton0618 technical analysis, please comment below if you have any question.
The ENTRY in the market will be taken only if the condition of Plancton0618 strategy will trigger.


KMD / BTC Channel 111%. Reversal zones. Work on a coin.After the price exited a descending wedge, a horizontal accumulation channel formed. External channel width 111%. Domestic about 50%. Liquidity is average.
The channel and pivot zones are shown on the chart. Price fixing above the channel resistance level (yellow zone) may serve as confirmation of further growth. Not overcoming this zone can serve as a price reduction to the indicated important channel support zone. Further, how the price will react to this support zone.
Now is not a good entry point, as there is uncertainty in the further price movement. Tool for observation.
Good potential entry points:
1) When fixing the price above the resistance of the current channel (yellow zone).
2) Entrance from the bottom of the active channel upon confirmation of support.
Stop loss
Set Stop Loss value with calculation of your trading strategy and money management. Stop Loss percentage should be adequate. What matters is not the Stop Loss value itself, but the entry point and your system of work.
The first potential target showed on the chart.
1) From channel resistance in case of consolidation + 60% and if the uptrend will develop even higher.
2) From the bottom of the channel about + 111%.
The previous trading idea for this coin gave + 55% from the moment of breaking the resistance of the downward wedge.

KMDBTC Forming Triangle Before Next Move UpKMDBTC broke out of long term downtrend and retested the previous diagonal resistance.
Now forming a triangle, and showing good price action. If volume continues increasing, I would expect this to pull a DRGN-esque move in the next week or two.