KSM is about to end his trending down soonI think KSM is about to end his trending down soon.
In short times KSM in a descending channel.
In long times KSM is in button line of his ascending channel.
I think maybe it is best time to buy KSM because KSM has no way to go except UP
KSMUSDT.P trade ideas

KSM Long HereKSM Sitting in the Symmetrical Triangle
RSI Moving ABOVE Based MA
Expecting a push and break above the falling resistance trendline


KSM BIG POTENTIALHello traders, how we can see Kusama in the bottom. We have big potential over 100%. DYOR
Happy new year.

ksmusdtlong term analysis , when ksm willl break this enormous triangle we'll take a long position
no financial advice

ksm triangleksm forming triangle which is going to breakout
buy
50% 296
50% 265
tp1: 320
tp2: 370
sl:hold midterm

KSMUSDT DailyPlotting Fibs Retracement Exercise
4 Confluences area of Fib Retracement
23.60% & 38.20%
38.20% & 50%
50% & 61.80%
61.80%
Breakout from the descending parallel channel
Breakpit from the downward trend line

LONG KSMUSDT | LONG KSM / USDT | Elliott Wave ImpulsiveThis can be an opportunity to take advantage of the last wave of the impulsive Elliott Wave Pattern.
Entry Price: 308.7
Target Profit: 347.7
Stop Loss: 302.6
Ratio Risk / Reward ≃ 6.30
Potential Profit: 12.54%
This could be a good opportunity associated with a margin position as the ratio risk/reward is good.

KSM - Long-term & Short-term RoadMap!Hello everyone, if you like the idea, do not forget to support with a like and follow.
Long-Term:
KSM is trading inside this giant symmetrical triangle in brown.
As per my trading style, I will be waiting for a third swing to form around the upper brown trendline to consider it valid then buy on its break upward. (projection in purple)
Short-Term:
As KSM approaches the lower bound/brown trendline, I will be looking for buy setups on lower timeframes. Any bullish reversal setup like a double bottom, trendline break, and so on...
Always follow your trading plan regarding entry, risk management, and trade management.
Good luck!
All Strategies Are Good; If Managed Properly!
~Rich

KSM/USDTKSM has flipped the RSI trend on the daily chart. However, the price is still unable to break 100 Daily EMA. This gives us nice #BuyTheDip. BTC is looking shaky still in the range between 20 -50 weekly EMA. Therefore watch out for stop hunt no need to rush slowly dca.
On balance volume give's a hint once btc cool of i see KSM doing well
Expected retrace 280 – 297
Key 250$ must hold!


KSMusdt Kusama is a public blockchain network that is running the exact same codebase as Polkadot. It is aimed to be a canary build for the Polkadot network which is an experimental and development environment for new features that...

KSMUSDT is testing the resistance 🦐KSMUSDT is testing the resistance after the price had a breakout from the descending channel.
IF the price is going to have a breakout, According to Plancton's strategy (check our Academy ), we can set a nice order
–––––
Follow the Shrimp 🦐
Keep in mind.
🟣 Purple structure -> Monthly structure.
🔴 Red structure -> Weekly structure.
🔵 Blue structure -> Daily structure.
🟡 Yellow structure -> 4h structure.
⚫️ Black structure -> <4h structure.

#KSMUSDT 6H Chart
Price recently bounced from the support at $264 and left a 6h demand zone at $274 which is still untested. MACD is still in a bullish territory, RSI is bought and EMAs are turning bullish. i expect price to come back down towards the 6h demand where it should bounce from aiming for the 4h supply at $333.

$KSM Idea going into Q1My thoughts on KSM going into 2022. The fundamentals are looking very nice to allow this to happen.

Break outFalling wedge pattern
$ksm break-out and retest done
Lets see bullish wave
Target $290-300
Stoploss $265

KSM - buy earlyThe chart shows that in order to say that the bearish trend is over, it will be necessary to wait for the breakdown of the normal trend line

KSMUSDT is testing the weekly resistance KSMUSDT is testing the weekly resistance inside the 4h channel.
IF the price is going to have a breakdown, According to Plancton's strategy (check our Academy ), we can set a nice order
–––––
Follow the Shrimp 🦐
Keep in mind.
🟣 Purple structure -> Monthly structure.
🔴 Red structure -> Weekly structure.
🔵 Blue structure -> Daily structure.
🟡 Yellow structure -> 4h structure.
⚫️ Black structure -> <4h structure.

KSMUSDT Price Update & TARight now KSM is ranging inside an ascending triangle which is a bullish sign and if break the resistance at 308$ level probably can see a good pump on KSM. the target for this triangle is at 345& and if we see the daily chart it's also forming a falling wedge which is also a bullish sign. levels to watch for resistance are 383$ and 439$. but if it breaks down it could find support at 214$ level.

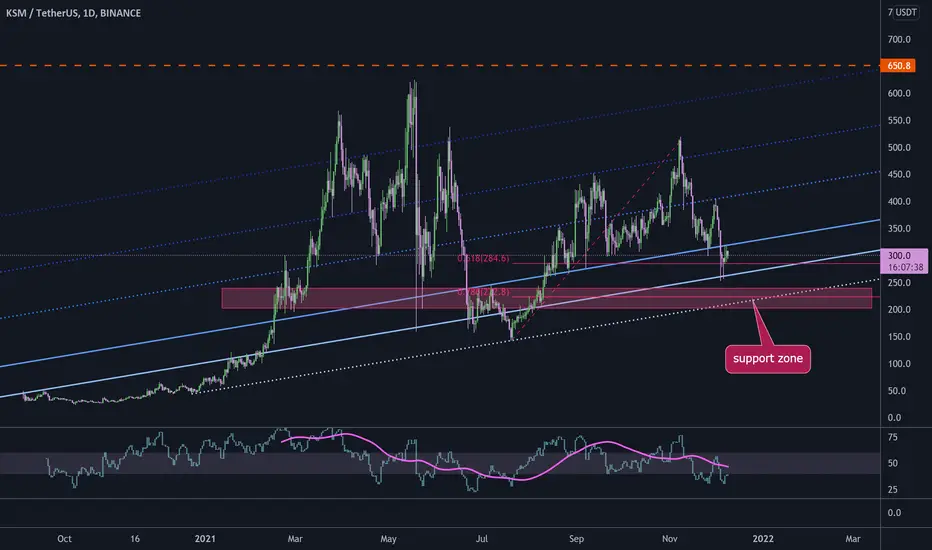
KSM potential to increase 100% to 190%#KSM/USDT
$KSM hold above long term ascending support that is the same with 0.618 fib level of last swing high.
it is possible to have another leg down to touch 0.786 fib level that is the same with a major support zone.
by the way if price bounce from here or $223, it will go up to ascending trend lines to reach $650.
KSMUSDT - Long💡💡#SIGNAL 💡💡
KSM / USDT
▶️ Buy NOW (30%) + 335.6 (70%)
🔴 SL - 319
Let's try the head and shoulders pattern
#KSMUSDT_4h_281121

