TradeCityPro | LDO: Watching for Breakout in DeFi Leader’s Range👋 Welcome to TradeCity Pro!
In this analysis, I’m going to review the LDO coin — one of the well-known DeFi projects within the Ethereum ecosystem with a significantly high TVL.
✔️ This project’s token currently has a market cap of $748 million, placing it at rank 86 on CoinMarketCap.
⏳ 4-Hour Timeframe
As you can see on the 4-hour chart, after a downtrend, LDO formed a bottom around the 0.676 zone and managed to rally up to 0.868.
🔍 Currently, the price is consolidating below that resistance in a ranging box. A breakout from either direction of the box could determine the next trend.
⭐ If the box breaks upward and the 0.868 level is breached, we can consider the prior downtrend over, and the price would be forming a new bullish structure. However, there is another resistance at 0.904 right above, and there’s a possibility of rejection from that level after the 0.868 breakout.
📈 For a long position, I personally plan to enter upon the breakout of 0.868. While it’s possible that the price might reverse from 0.904, I prefer having an earlier entry and using a more accessible trigger.
🔽 On the other hand, if the box breaks to the downside, the price might revisit the 0.676 support and potentially start a new bearish leg in line with the longer-term downtrend.
📉 The first short trigger is the break of 0.818 (the lower boundary of the box), but there’s another minor support at 0.795, which may cause a bounce.
👀 I personally prefer to wait for the 0.795 level to break for a short entry, given that market momentum is currently bullish, and I prefer a more reliable trigger for shorts.
📊 Volume within this range has been decreasing, which is normal in such consolidation phases. The longer the price stays in this range, the lower the volume tends to be — and typically, a breakout will lead to a sharper move.
The RSI oscillator also has a support zone at 43.17. If this level is broken, it could signal incoming bearish momentum and increase the probability of a downside breakout.
📝 Final Thoughts
This analysis reflects our opinions and is not financial advice.
Share your thoughts in the comments, and don’t forget to share this analysis with your friends! ❤️
LDOUSDT.PS trade ideas

LDOUSDT 1D AnalysisLDO ~ 1D Analysis
#LDO Buy after successfully penetrating this resistant line with a short -term target of at least 10%+ from here.

LDO Is The Best Asset NowHello, Skyrexians!
Some of you may be remember my article which I shared more than 1 year ago where called BINANCE:LDOUSDT the worst asset and it dumped exactly as predicted. Then made a mistake making assumption that some coins can grow while other will go down. This assumption has the very low probability to be truth, now I have the clear view that entire crypto will go up soon and LDO can be the greatest performer.
On the weekly chart we can see the huge 3 year accumulation. Current point can be the best to buy. We have bullish divergence on Awesome oscillator, green dot on Bullish/Bearish Reversal Bar Indicator . Moreover, current price action looks like a spring on Wyckoff cycle. The exact target impossible to predict, but I think it shall be above $12.
Best regards,
Ivan Skyrexio
___________________________________________________________
Please, boost this article and subscribe our page if you like analysis!

LDO Weekly AnalysisLDO Weekly Analysis
LDO is showing a positive divergence on the weekly timeframe, indicating a potential upward move toward the 2.590 resistance level. However, for a more confident entry, the price needs to break above the $1 resistance with strength on the weekly chart.
Even in a pessimistic scenario, where the price drops by 26% to its support level, the risk-to-reward ratio remains attractive.
Follow us for more quality and insightful updates!


LDO is bearish for MidTerm (2D)Before anything, pay attention to the timeframe; it’s a 2-day timeframe and requires patience.
From the point where we placed the red arrow on the chart, it seems that the bullish LDO pattern, which was a triangle, has completed. LDO has now entered a bearish pattern of the same degree as the previous bullish pattern.
LDO is expected to remain bearish in the medium term and not break above the red box marked on the chart.
The low-risk area for buy positions in spot has been identified for buyers.
The closure of a daily candle above the invalidation level will invalidate this analysis
For risk management, please don't forget stop loss and capital management
Comment if you have any questions
Thank You

LDO - big lie - Many influencers have been touting this coin.
- the coin is found in the side
- the exit was down and I expect the downtrend to continue
if you like the idea, please "Like" it. This is the best "Thanks!" for the author 😊 P.S. Always do your own analysis before a trade. Put a stop loss. Fix profits in installments. Withdraw profits in fiat and please yourself and your friends.

LDO is ready to moonLDO is seen as a crossroads between flight and another minor correction.
Buy now or wait to below line
Tp1 0.8
Tp2 1.35
Tp3 2.45

Is This the Final Drop Before a Major Reversal? Read This NOW! Yello, Paradisers! Are we about to witness the final leg of this move, or is one last shakeout coming before a massive reversal? Let’s break it all down using Elliott Wave principles.
💎Wave 1 initiated the downtrend, marking a strong sell-off from higher price levels. Volume surged during this phase, signaling institutional selling and overall market panic. This aggressive downward move set the foundation for the corrective Wave 2.
💎Wave 2 began as the price rebounded after hitting the local low at $1.406. This move aligns with a typical Elliott Wave correction, often retracing 50%–61.8% of Wave 1. The recovery phase pushed the price back up, potentially reaching as high as $1.964 before the next major move.
💎Wave 3, the strongest and longest in the sequence, started once the price failed to sustain above $1.964. This move could extend all the way down to $0.809, a critical level where selling pressure is expected to peak. Historically, volume is highest during Wave 3, indicating aggressive selling and potential accumulation zones forming.
💎Wave 4 might be unfolding right now, forming a short-term recovery. If the price retraces toward $1.392 but fails to break above it, the bearish wave count remains intact. It’s crucial to note that Wave 4 must NOT enter the price range of Wave 2—if it does, the entire Elliott Wave structure is invalidated, suggesting an alternative pattern like an ending diagonal or a larger correction.
💎Wave 5 is the final impulse wave. If Wave 4 faces rejection below $1.392 and consolidates, the market could see the beginning of Wave 5, pushing price toward the $0.746 support zone. This phase typically marks the last exhaustion move before a potential market reversal or a shift in structure.
Patience and strategy win the game, Paradisers! The market is designed to shake out weak hands before the real move happens.
MyCryptoParadise
iFeel the success🌴

LDOUSDT 4DLDO ~ 4D Analysis
#LDO Buy when visiting this support with a short -term target of at least 15%+.

#LDO/USDT#LDO
The price is moving within a descending channel on the 1-hour frame, adhering well to it, and is heading for a strong breakout and retest.
We are experiencing a rebound from the lower boundary of the descending channel, which is support at 0.988.
We are experiencing a downtrend on the RSI indicator, which is about to break and retest, supporting the upward trend.
We are looking for stability above the 100 Moving Average.
Entry price: 1.008
First target: 1.022
Second target: 1.042
Third target: 1.067

LDOUSDT 1WLDO ~ 1W Analysis
#LDO So far it still continues to maintain this support. Buy gradually from here with a short -term target of at least 20%+.

LDO - the only way is up from here!MIL:LDO -@LidoFinance
Ethereum staking at its best!🥇
#LDO has been rejecting the $0.9 – $1 zone like a charm.
As long as this support holds, further upside toward the $1.5 round number and resistance is expected.🚀
Powerful protocol LDOThis protocol best business model in all crypto. Lido finance the biggest Tvl on all ETH. I have it and I’ll get more. But following my indicator the best price to 0,613
$ per one LDO.

Trading opportunity for LDOUSDTBased on technical factors there is a Buy position in :
📊 LDOUSDT
🔵 Buy Now
🪫Stop loss 0.800
🔋Target 1.150
📏 R/R 1,8
💸RISK : 1%
We hope it is profitable for you ❤️
Please support our activity with your likes👍 and comments📝

TradeCityPro | LDO: Comprehensive Market Analysis and Prediction👋 Welcome to TradeCity Pro!
In this analysis, I want to review LDO for you. It is one of the key DeFi platforms, and its token currently holds a market cap of $945 million, ranking 72nd on CoinMarketCap.
📅 Weekly Timeframe
On the weekly timeframe, we can see a range box between the $0.957 and $3.389 levels, where the price has been fluctuating for almost two years.
🔽 If you already hold this coin, I recommend activating your stop-loss in case the $0.957 level is broken and waiting for bullish momentum to re-enter the market before buying again.
📈 If the price holds above the $0.957 support, it could rally back toward the top of the range at $3.389. The key trigger levels between the current price and the top of the box are $1.447 and $2.488.
🚀 The main buying trigger is at $3.389, as breaking this level could lead to significant capital inflows, potentially initiating a long-term bullish trend.
📅 Daily Timeframe
On the daily timeframe, a range box between $1.447 and $2.387 had formed, which was broken to the downside, leading to a bearish leg. The main support level is $0.957, and if it fails to hold, the price could enter a new bearish cycle.
🛒 For spot buying, there isn’t a clear trigger yet, so we need to wait for a new structure to form. However, if the price rallies sharply, you could consider entering on a break above $1.489.
💫 As seen on the chart, the red candle volume is significantly higher than the green candles, indicating strong seller dominance. Additionally, the RSI is near the 30 level, and if it breaks below this zone, the bearish scenario becomes more likely.
📝 Final Thoughts
This analysis reflects our opinions and is not financial advice.
Share your thoughts in the comments, and don’t forget to share this analysis with your friends! ❤️

Lido DAO: Long-Term Support—Long-Term Sideways—Long-Term BullishSome charts just make technical analysis easy. The same support level that worked in late 2022 worked again in late 2024. The present correction is ending as a higher low in relation to this same long-term support, the black line on the chart.
Since the market bottom, June/July 2022, LDOUSDT has been sideways with a wide range. The last bullish breakout was really small and the present retrace is also small, the market always seeks balance, so a small breakout leads to a small retrace.
There is more.
The consolidation phase is very long, years of sideways action. The market always seeks balance. A long consolidation phase will lead to a very strong bull-market. The bull-market is now, it is happening now, starting this month —March, this year (2025) and it will extend for a long-term.
So we have long-term support, long-term sideways and a long-term bullish market.
Thanks you for reading.
Namaste.

ldo is goint to give you some profitLDO is going to give you some profit from this point . there is a good order block down here

#LDO/USDT#LDO
The price is moving in a descending channel on the 1-hour frame and is adhering to it well and is heading to break it upwards strongly and retest it
We have a bounce from the lower limit of the descending channel, this support is at a price of 1.20
We have a downtrend on the RSI indicator that is about to break and retest, which supports the rise
We have a trend to stabilize above the moving average 100
Entry price 1.23
First target 1.28
Second target 1.34
Third target 1.41

LDOUSDTWe can attempt to short LDOUSDT from specified level as it make LH , also 0.5 FIB Level occur indicate that it moves downward.
SL , TP mention in chart.

#LDOUSDT: Triangle Breakout – Next Move?Market Overview:
#LDOUSDT has been in a strong uptrend and recently formed a triangle pattern on the 1-hour timeframe. This pattern typically signals trend continuation, and we just witnessed a breakout!
Key Observations:
🔹 Triangle breakout confirmed – bullish signal!
🔹 Resistance Level: Watch for a clean break for further confirmation.
🔹 Potential Targets (TPs): Higher highs expected if momentum holds.
Strategy:
🔹 If price retests the breakout zone and holds, we could see a strong bullish continuation.
🔹 Invalidation: If price falls back into the pattern, we may see a fakeout scenario.
What’s your take? Will #LDOUSDT pump higher or is this a bull trap? Share your thoughts below!
Follow for more chart updates, trade ideas, and market insights!

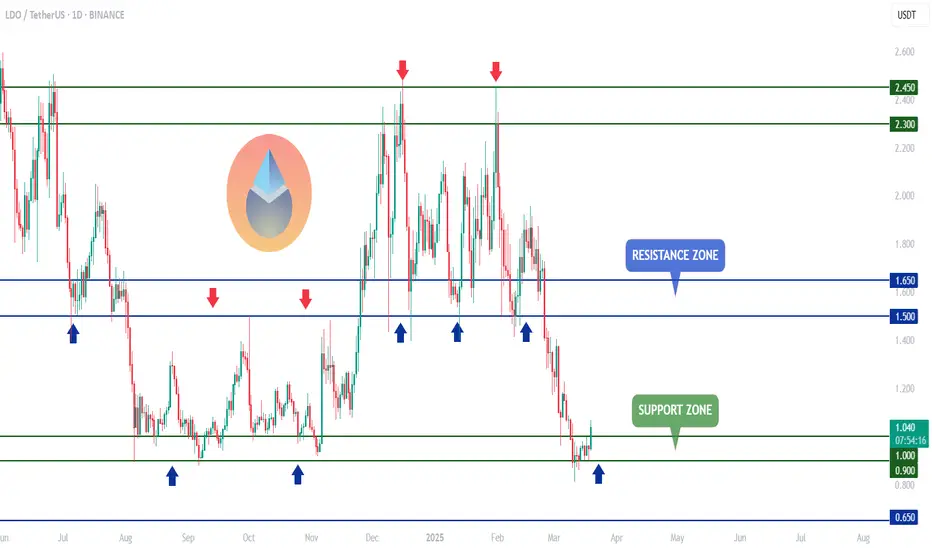
LDO/USDT Technical Analysis – 1D# 📉 LDO/USDT Technical Analysis – Daily Timeframe
🔍 LDO price is currently sitting on its **90-day support level**. This is a crucial area because if the price manages to hold this support, we could see an upward move toward **2.35 USDT**, which is a key daily resistance level.
📌 **Bullish Scenario:** If buyers step in and defend this support zone, we might witness a rally toward **2.35 USDT**, representing a **51% increase** from the current price.
⚠ **Bearish Scenario:** However, if the **1.544 USDT** support level is lost on the daily timeframe, the next critical support would be at **0.925 USDT**. This is the **last major support zone** on the daily chart, and losing it could trigger further downside.
📊 **Indicators Overview:**
🔹 **Volume:** An increase in volume at key levels signals strong buying or selling pressure. Currently, volume is declining compared to the average, indicating uncertainty among traders.
🔹 **RSI:** The Relative Strength Index (RSI) is at **44.22**, suggesting that the market is in a neutral zone with balanced buying and selling pressure.
👀 **Do you think LDO can bounce from this support level, or are we about to see another drop? Share your thoughts in the comments!**
---
🔹 **This analysis is for informational purposes only and should not be considered financial advice. Please manage your risk accordingly before making any trading decisions.**
✅ If you agree with this analysis, drop a comment and share it with others! 🚀
