SHORT LidOhello,
imo there is a decent opp to short mr LIDO
wait for confirmation to dump it
SL is mentioned on the chart
use low leverage
good luck.
LDOUSDT trade ideas

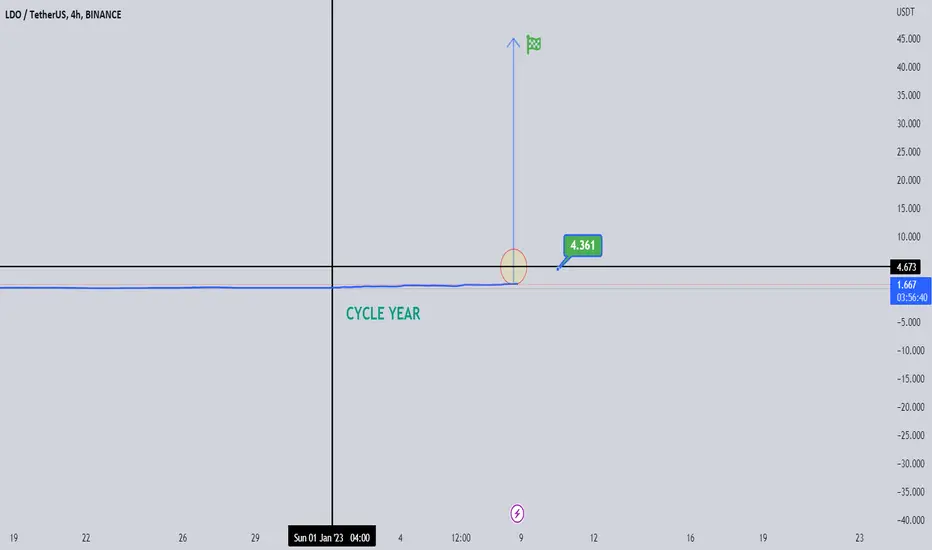
Price prediction LDO 2023 : $45 AND ETH TRENDS COMING ON LDOPrice prediction LDO for 2023: $45
LDO showing at this moment depending on the structure volume as the best cycle coins of the moment, the main reasons are the whale DCA trend and also the expecting of services that will be active soon with ETH.
This expectation could seem on the large side, but it's not the first time we have seen Cycle coins start increasing if we check the history that ASX and more coins did even more than a 2K % increase in a short-term period.
We are still in a bear market, but even this means not that there is no chance coins could increase to higher targets as LDO.
Since the whale increases trends on this coin it seems this coin is able to make higher gains also depending on TA.
We will list our Long term view of 2023 Target, and with time we will see if this coin is able to make the unexpected high breakouts.
As we expect this is just the start of the increase in LDO.
This is not trading advice, it's our personal view of the target for 2023.
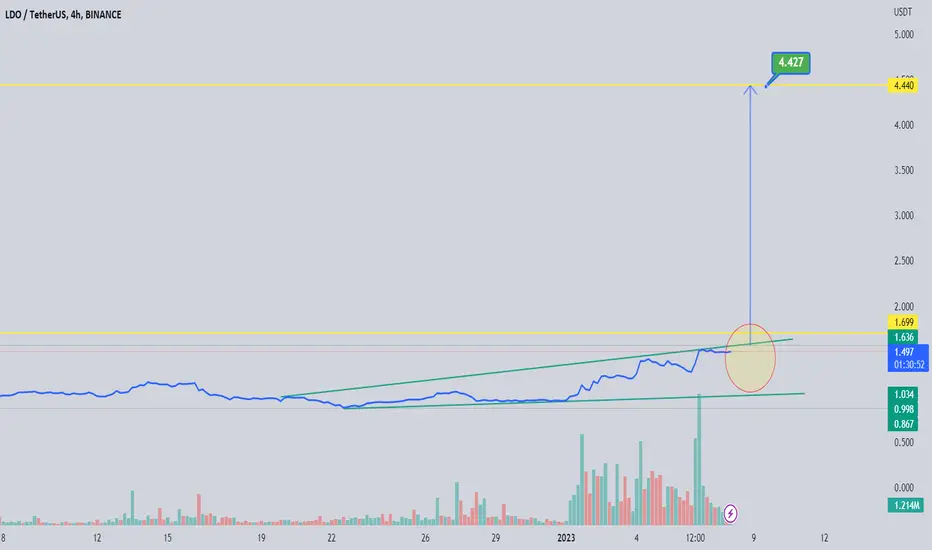
or Focus is first on the target of $4.40 as that target is a very interesting key level for the uptrend.
Do you think that we are going to see in 2023 LDO price action of $45 USD?
This is not a trading idea, its a price prediction for 2023
This counting is based on algorithms breakout calculations including market study.
Its not first time we did saw coins building a cycle before and entering amounts where the most did not expect before.

LDO : ENTERING INTO NEW CYCLE AND WHALES BREAKOUT SEEMS ON WAYLDO is at a very important point, and with the last data we did scan it seems it has a good chance that the whales will break out this coin to the target of $4.40 and above.
Same time this coin seems to enter a cycle trend.
Most coins are not in the cycle trend, and 99% of coins are still not in the cycle trend.
we expect depending on this study that LDO can shows coming time unexpected breakout trends, this all depends on our study where we did scan more than 600 coins on the possibility of growth for the coming time, and LDO has interesting views.
There are more reasons to show us the possibility of a breakout, it will stay crypto we don't know the future, and we only predict depending on the data we have, on this reason always do your own study.
See this idea as viewed from our side, where we expect a new cycle trend for LDO.
Let's hope for the best for every trader in 2023, and that the dreams will come out.
LDO : CAN SHOWS UNEXPECTED PRICE ACTION 2023 : LONG TERM VIEWThis update is not made for no reason.
LDO is the only coin that is at the top that shows a structure trend.
it's the coin that dit got interesting depending on some structure trends.
When we check this coin we see some effects of coins that did breakout before and increased in the zone of high trend.
This coin also achieved the cycle trend.
Our first important target for this coin is $4.40
If we would count the price depending on the structure that it shows including the cycle trend and the TA study, we could expect unexpected price action in 2023.
The price that this coin could do long-term is $45 USD. it's a price action expecting and not trading advice.
Let's see what the market will bring, this coin will get a follow since it can show unexpected trends.
This idea is a long-term view.
LDO 4hr Analysis | Potential Long SetupLDO has flipped a critical resistance zone at 1.5536 and confirmed. Now looking for 1.7404.
Follow your risk management.

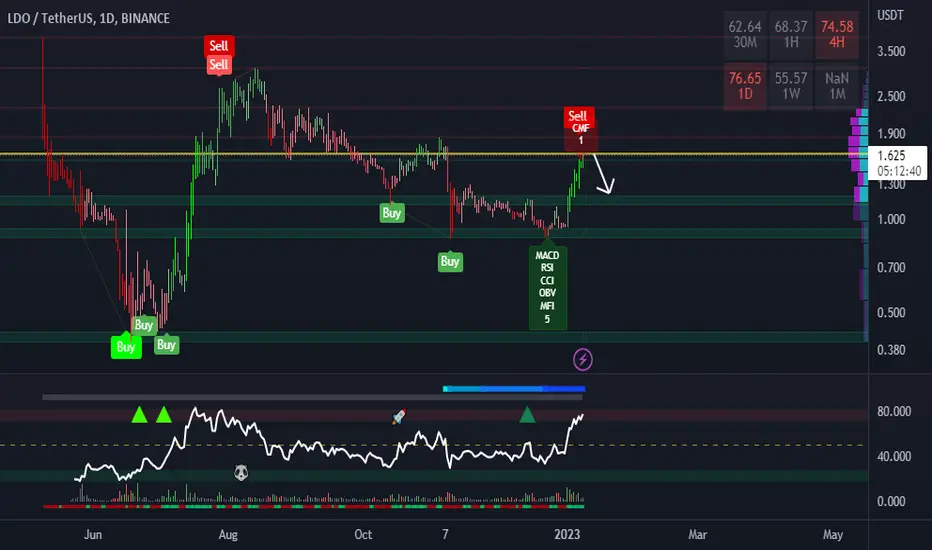
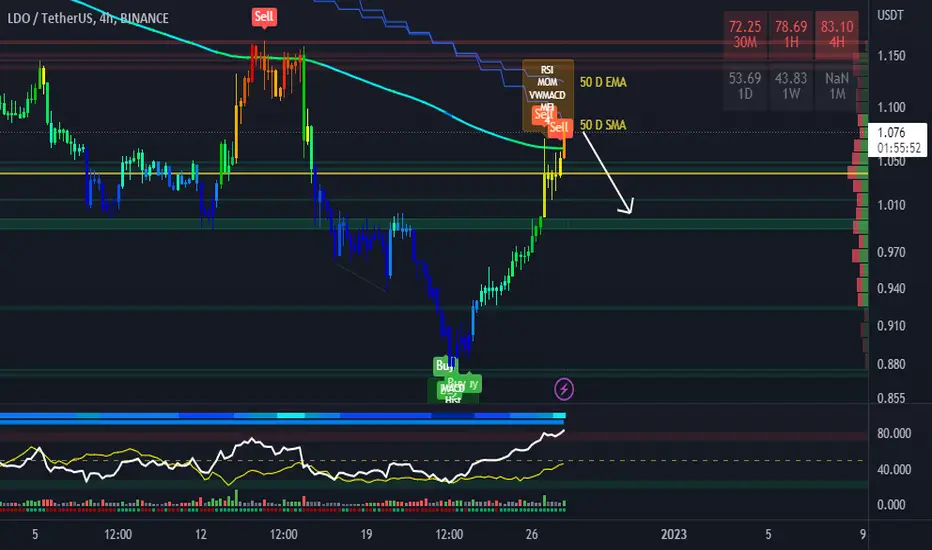
LDOIdea: The price is in a strong overbought zone. POC is a strong resistance level. The probability of the price falling to the next strong support level is high

BABA ALWAYS RIGHT (100% SUCCESS RATE): LDO WILL DOWN TO 1.35 SOOBABA ALWAYS RIGHT (100 % SURITY): LDO USDT WILL BE DOWN TO 1.35 AND EVEN LOWER after reaching 1.6 due to...
over bought... very much unstable wavy nature.. fundamentally very weak... very bearish...
sell sell sell fast...

LDO updatelidodao Retest to 1.43 or 1.34 after that well i don't think this one is stopping anytime soon


LDOUSDT ANALYZEAs the price drop by the compression to the flag limit the long scenario is possible as i shown.

Short areaWeekly support came. No one knows what will be next, but i opened short position from here with low leverage.

BABA ALWAYS RIGHT(100%)- LDO USDT WILL FALL TO 1.32 AND BELOW...BABA ALWAYS RIGHT: LDO USDT WILL GO DOWN TO 1.32 AND BELOW after reaching 1.48..
very unstable... overbought... wavy seems bearish too much...
100% truth prediction till now...
sell sell sell...

BABA ALWAYS RIGHT: LDO USDT WILL UP TO 1.6 AND ABOVE (100%)BABA ALWAYS RIGHT (100 PERCENT CORRECT TILL NOW): LDO USDT WILL GO TO 1.6 ...
VERY stable... wavy nature bullish too much... buy buy buy.... not financial advice...

BABA ALWAYS RIGHT: LDO USDT WILL DOWN TO 1.15 AND BELOW...BABA ALWAYS RIGHT: LDO USDT WILL GO DOWN TO 1.15 AND BELOW after going up to 1.38 and above....
overbought coin, very unstable., wavy nature show very much bearish...
sell sell sell....

LDOUSDT BUTTERFLYButterfly
The Butterfly Pattern is a distinct 5-point extension structure that was discovered by Bryce Gilmore and further defined by Scott Carney. It has specific Fibonacci measurements for each point within its structure and it is important to note that D is not a point, but rather a zone in which price is likely to reverse, called the Potential Reversal Zone (PRZ). The B point retracement of the primary XA leg lies at 0.786 and the PRZ consists of 3 converging harmonic levels: 1) 1.27 extension of the primary XA leg, 2) AB=CD pattern, either equivalent or 1.27 and 3) Extreme BC projection of 2.00, 2.24 or 2.618.
The first target would be the 382 retracement of AD and the second target the 618 retracement of AD. Common stop levels lie behind the next structure level after the D point or the 1.41 extension of XA. Conservative traders look for additional confirmation. These patterns can be bearish and bullish. TradingView has a smart XABCD Pattern drawing tool to visually identify 5-point reversal structures.
Likes and comments if you have questions! 🍌
Thanks!

LDO shortI do think there is a chance this run up could continue..... but i believe we at least drop down to 1.05 to 1.02 for strength to push again
I have the support lines in broken line form on the chart The green line is where i am looking to take profit and looking for reversal back up. SL is gonna be just above the trendline if we break back over it we should fly

$LDO Swing LongLooks like it will reclaim its weekly range after a bulllish day. Target range hi, may take a while to play out.

LDO 1.01.23I expect a second rise in LDO. If this rise comes, I think to open a short position from the region I marked on the chart(1.06 - 1.08). This is a very risky position. It is best not to use high leverage.
What I write here serves as a note to myself. Does not include investment advice.

LDO Lido Dao LONG TRADE 20230101Red -> Green: Confirmed the Demand Zone (Blue * N indicated the support)
DISCLAIMER
This is only a personal opinion and does NOT serve as investing NOR trading advice.
Please make your own decisions and be responsible for your own investing and trading Activities.

LDOIdea: The price has risen to the daily 50 MAs. The 200 EMA is broken on the 4 hour chart. The price is in the zone of strong overbought, many bearish divergences and signals are formed. High probability of price correction
LDOUSDTPolygon Ecosystem, Infrastructure, Arbitrum Ecosystem, Decentralized Finance (DeFi), Ethereum Ecosystem, Optimism Ecosystem, Liquid Staking Governance Tokens
