Chainlink (LINK): Possible Reclaim of Bearish CMESellers are showing strong dominance where recently we had broken and secured the 200EMA line and also reached one of our targets on other analysis from last week.
We are now looking and aiming at that bearish CME gap where we might be seeing some sort of sideways movement to form and eventually a

LINK in coming Weeks ...frankly, Bitcoin will reach $30 in the coming weeks.
Give me some energy !!
✨We spend hours finding potential opportunities and writing useful ideas, we would be happy if you support us.
Best regards CobraVanguard.💚
_ _ _ _ __ _ _ _ _ _ _ _ _ _ _ _ _ _ _ _ _ _ _ _ _ _ _ _ _ _ _ _
✅Thank you, and f

LINK — Time to Load Up!
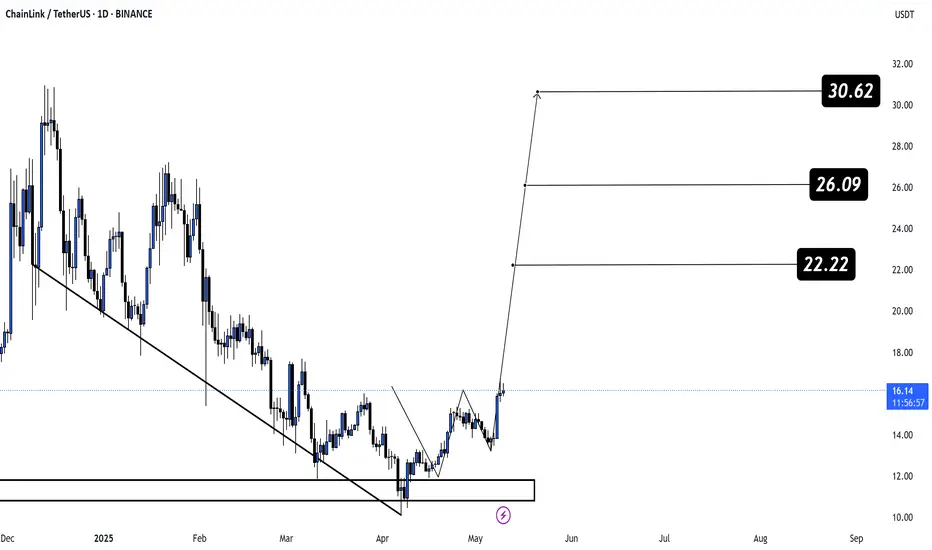
CRYPTOCAP:LINK has just confirmed a bullish inverse Head & Shoulders breakout and smashed through the crucial $15.5 resistance — the strongest price level since late 2024!💥
This breakout unlocks massive upside potential:
🎯 Target 1: $22.22
🎯 Target 2: $26.09
🎯 Target 3: $30.62
Technicals are
POSSIPBLE BULL SET UP ON LINKUSDTLINK broke out of consolidation phase . IT also broke out of downward counter channel and 15.27 resistance level signaling a potential upward movement. If price eventually break out of the main channel ,the bullish trend will hold.

Chainlink (LINK) Update (12H) – Bullish Structure StrengthensIn our previous analysis, I outlined multiple technical reasons suggesting that LINK was preparing for a major bullish phase. Since then, LINK has surged over 25% from the level I initially highlighted.
Upon reassessing the chart from a broader perspective, I’ve identified a reversed Head and Sh

Link Analysis (12H)Chainlink (LINK) Technical Outlook – Elliott Wave Perspective
After applying Elliott Wave Theory, the chart appears to speak for itself — the downward corrective phase seems to have concluded.
Zooming into lower timeframes, there are several bullish signs suggesting that LINK is primed for an upwa

LINK Broading wedged Currently it comes out of this support zone. Maybe this support block you can consider to start buying back from here with a short -term target of at least 10%+.

$LINK just broke out CRYPTOCAP:LINK just broke out of its downtrend and 100-day SMA!
Bullish reversal confirmed eyes on $30 +86%.
Entry: CMP
- TP1: $18.90
- TP2: $23.50
- TP3: $29.90
Stop Loss: $14.80
Use 3–5x leverage max. DYOR, NFA.

LINKUSDT 1D Analysis LINK ~ 1D Analysis
#LINK Successfully retested this support block. This would be a very good buy for now, with a short term target of at least 10%+.

Chainlink Trend update on 06/May/2025Chainlink market update on 06/May/2025. Currently, it break 13.8$ and keep our eye to see whether it touch 12.8$ zone and reverse or not.
#Chainlink #Defi

See all ideas
Summarizing what the indicators are suggesting.
Oscillators
Neutral
SellBuy
Strong sellStrong buy
Strong sellSellNeutralBuyStrong buy
Oscillators
Neutral
SellBuy
Strong sellStrong buy
Strong sellSellNeutralBuyStrong buy
Summary
Neutral
SellBuy
Strong sellStrong buy
Strong sellSellNeutralBuyStrong buy
Summary
Neutral
SellBuy
Strong sellStrong buy
Strong sellSellNeutralBuyStrong buy
Summary
Neutral
SellBuy
Strong sellStrong buy
Strong sellSellNeutralBuyStrong buy
Moving Averages
Neutral
SellBuy
Strong sellStrong buy
Strong sellSellNeutralBuyStrong buy
Moving Averages
Neutral
SellBuy
Strong sellStrong buy
Strong sellSellNeutralBuyStrong buy
Displays a symbol's price movements over previous years to identify recurring trends.