LRC - Sine Line Says: Bullish!Hello TradingView Family / Fellow Traders! This is Richard, also known as theSignalyst.
The picture says it all!
📈For the bulls to take over and ignite the next bullish wave in line with the Sine Line cycles, a break above the $0.12 structure marked in blue is needed.
📚 Reminder:
Always stick

LRC long loopringIm just seeing opportunities to go long on good value tokens.
None of this is financial advice, im just pointing out that if you are patient and know what you are looking for then the right times to trade are easy to spot.
my long strat has triggered

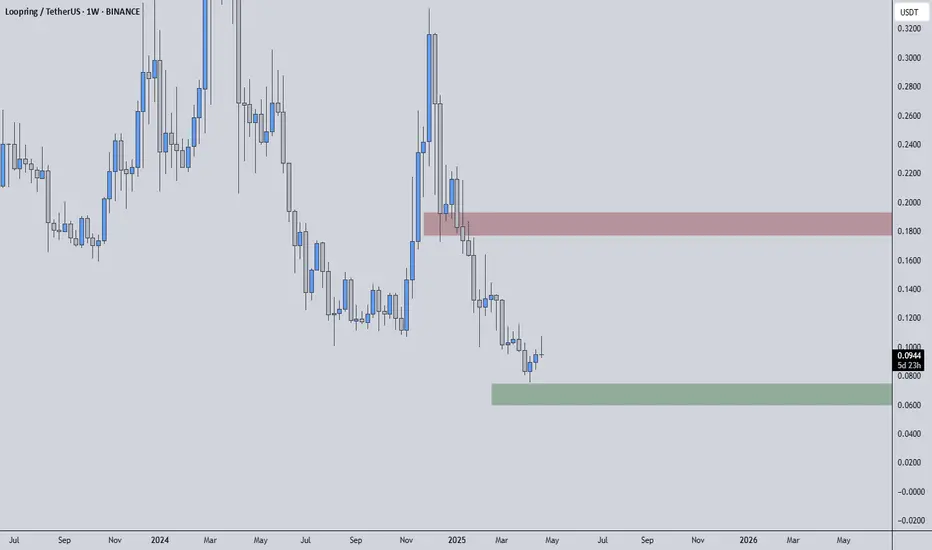
LRCUSDT | Weak Support, Strong Resistance — Proceed with CautionLRCUSDT is trading between clearly defined zones, where the red box acts as a significant resistance and the green box serves as a mild support level. However, the critical detail here is that the support does not appear very reliable — and that should make you extra cautious if you're planning to l
LRCUSDT 1WLRC ~ 1W Analysis
#LRC This is the lowest support at this time, maybe you can consider starting to buy back from here with a short -term target of at least 15%+

LRC: BULLISH divergence on daily chartBullish Divergence Confirmed:
Both the RSI (Relative Strength Index) and MACD (Moving Average Convergence Divergence) are showing bullish divergence on the daily chart. While the price has made a lower low, the RSI and MACD have formed higher lows, indicating weakening downward momentum and a potent

LRC/USDT – Horizontal channel. Continuing to work.Loopring - is an open protocol designed for building decentralized crypto exchanges.
CoinMarketCap : #262
Since the publication of my trading idea, the price has reached the resistance zone of the inner channel at $0.3338 (+158%). From there, it retraced back to the support of the outer channel,

LRC on the way to a new lowThe price is around major resistance level and is likely to drop significantly in the coming days.

Loopring (LRC/USDT) Daily Chart Analysis📊 Trend: Bearish (Descending Channel)
🔹 Key Levels:
✅ Support: $0.12 - $0.13 (Demand Zone)
🚀 Resistance: $0.18 - $0.35
Market Outlook & Strategy
🔸 Bullish Scenario: If LRC breaks above the descending channel, it could aim for $0.18 and potentially $0.34.
🔸 Bearish Scenario: If price fails to brea

LRCUSDT 1WLRC ~ 1W Analysis
#LRC If you still have a Conviction on this coin. Maybe you can consider this support to start buying back from here with a minimum target of 20%+.

Look at this disgusting investmentHolding since May of '20.
I'm going to give this until August before I move 100% crypto portfolio into Arweave.

See all ideas
Summarizing what the indicators are suggesting.
Oscillators
Neutral
SellBuy
Strong sellStrong buy
Strong sellSellNeutralBuyStrong buy
Oscillators
Neutral
SellBuy
Strong sellStrong buy
Strong sellSellNeutralBuyStrong buy
Summary
Neutral
SellBuy
Strong sellStrong buy
Strong sellSellNeutralBuyStrong buy
Summary
Neutral
SellBuy
Strong sellStrong buy
Strong sellSellNeutralBuyStrong buy
Summary
Neutral
SellBuy
Strong sellStrong buy
Strong sellSellNeutralBuyStrong buy
Moving Averages
Neutral
SellBuy
Strong sellStrong buy
Strong sellSellNeutralBuyStrong buy
Moving Averages
Neutral
SellBuy
Strong sellStrong buy
Strong sellSellNeutralBuyStrong buy
Displays a symbol's price movements over previous years to identify recurring trends.