"Order Block Resistance vs. Bullish Momentum: Who Wins?"
🧠 Reading Higher Timeframe Trends at Order Blocks – When Bullish Momentum Meets Resistance
When we analyze the trend in a higher timeframe and notice that price action is approaching or reacting to an order block, this should be treated as a potential resistance zone—even if the indicators still show bullish strength.
✅ What Confirms a “Strong Bull” Zone?
AO and RSI are both holding above the zero line, showing no reversal waves or strong sell signals.
The market is still in a bullish trend, even at resistance—but caution is required near order blocks due to potential reversals or liquidity grabs.
🔁 How to React When Price Hits an Order Block: Reconfirm Using 15-Minute Chart
Drop down to the 15-minute timeframe and recheck the trend using the same tools:
Look at the Confirmation Trigger (ChoCH).
If price remains above the confirmation level, then the bullish trend from the higher timeframe remains intact.
If price falls below the confirmation line, that’s your early signal that:
✅ A bearish reversal is forming on the 15m.
⚠️ The higher timeframe structure may be ending or entering distribution.
Even if the Quantum zones are shifting or adapting dynamically, the confirmation level remains your anchor.
📌 Summary:
Bullish AO/RSI above the zero line = still a strong trend.
Order block = natural resistance → stay cautious.
Always return to 15-minute timeframe to verify trend alignment.
Confirmation Trigger (ChoCH) is your decision point:
🔼 Above = trend continues.
🔽 Below = potential trend reversal.
0R1I trade ideas

Flag like structure 2WPrice is consolidating in a downward channel or flag like structure; a bullish breakout can lead to price reaching to 134.85 price range,and a bearish breakout to price reaching 97.44 price range. Notice price is also between the 10 EMA in blue above and the 50 EMA in purple below. CCI is slowly returning from oversold territory. Stochastic RSI had a bullish crossover in oversold region. RSI is neutral. Price is also building up pressure in the Fibonacci golden zone.

NVDA Day Trade Plan for 04/29/2025NVDA Day Trade Plan for 04/29/2025
📈 111.90 109.90
📉 105.90 103.90
Thanks to all my followers! Truly appreciate the support!
Please like and share for more ES/NQ levels Tues & Thurs 🤓📈📉🎯💰
*These levels are derived from comprehensive backtesting and research and a quantitative system demonstrating high accuracy. This statistical foundation suggests that price movements are likely to exceed initial estimates.*

Nvda low time frameLocal price action - the gap from 4/29 was filled in, but another was left on 4/30. During aftermarket hours the price jumped up to approach the weekly level above and dropped back down. We got a naked untapped pivot point below along with the range POC point of control, not a bad week of price action.

CORRECTED. NVDA HEADING INTO MAY 25'Still Bearish.
Clear top and been working down ever since
Yet another reject near the .382 FIB LEVEL, which was a reload zone in Q3 and Q4 of 2024.. now a sell zone since Q2 25' began as its cooled off from ATH to end 24 and begin 25.
Looking to buy @ .236 & lower.
Would not take a BUY higher until a break & hold above .5 to confirm some strength to an upside move.
NVDA overall as a company is going to be a powerhouse in multiple spaces in the future, we can all see that. It's not going anywhere and has multiple huge investments to push its industry hold even higher and revenue down the line to increase.
Their wide range of partnerships within the autonomous driving space with companies like GM, Toyota, TSLA (for its chips) and more position NVDA to be one of, if the not THE the largest market cap companies within the next 10 years to me.
Autonomous driving I personally feel will begin to make its way to a MAINSTREAM space beginning around 2030 and by 2030 will have an extreme space in day to day by 2035.
Long term vision beats short term gain!

NVDA Heading into March 25'Still Bearish.
Clear top and been working down ever since
Yet another reject near the .382 FIB LEVEL, which was a reload zone in Q3 and Q4 of 2024.. now a sell zone since Q2 25' began as its cooled off from ATH to end 24 and begin 25.
Looking to buy @ .236 & lower.
Would not take a BUY higher until a break & hold above .5 to confirm some strength to an upside move.
NVDA overall as a company is going to be a powerhouse in multiple spaces in the future, we can all see that. It's not going anywhere and has multiple huge investments to push its industry hold even higher and revenue down the line to increase.
Their wide range of partnerships within the autonomous driving space with companies like GM, Toyota, TSLA (for its chips) and more position NVDA to be one of, if the not THE the largest market cap companies within the next 10 years to me.
Autonomous driving I personally feel will begin to make its way to a MAINSTREAM space beginning around 2030 and by 2030 will have an extreme space in day to day by 2035.
Long term vision beats short term gain!

HOW-TO: Use the Camarilla Pivots & BBT Strategies indicatorThis how-to shows the Camarilla Pivot & BBT Strategies indicator in action, the 5-minute timeframe is ideal for this. It shows the price action reacting to the HA play (S3 to R3 traversal). The "H" means that the ticker is in a Higher range on this day, the "A" refers to the label on the strategy in the image. In fact, the price does past R3 (which is the exit point) and reaches R4, at which point it trigger the "E" play, which is an R4 extreme reversal. A great trade, if you took it!

NVDA longNASDAQ:NVDA has borken out of its channel and is pushing up, forming a dubble bottom. NASDAQ:NVDA is looking very bullish based on TA rnight now.

NVIDIANVIDIA Corp engages in the design and manufacture of computer graphics processors, chipsets, and related multimedia software. It operates through the following segments: Graphics Processing Unit (GPU), Tegra Processor, and All Other. The GPU segment comprises of product brands, which aims specialized markets including GeForce for gamers; Quadro for designers; Tesla and DGX for AI data scientists and big data researchers; and GRID for cloud-based visual computing users. The Tegra Processor segment integrates an entire computer onto a single chip, and incorporates GPUs and multi-core CPUs to drive supercomputing for autonomous robots, drones, and cars, as well as for consoles and mobile gaming and entertainment devices. The All Other segment refers to the stock-based compensation expense, corporate infrastructure and support costs, acquisition-related costs, legal settlement costs, and other non-recurring charges. The company was founded by Jen Hsun Huang, Chris A. Malachowsky, and Curtis R. Priem in January 1993 and is headquartered in Santa Clara, CA.

Trading the Impulse Rally Retracement — Price and Time Symmetry Trend is observed from an impulse run’s lowest/highest point and projected outwards in symmetrical fibonacci retracement via price/time from the first reversal candle to the end of the rally, creating crosshairs. These ‘crosshairs’ visually represent the trending ‘price distribution projection’ in price/time symmetry.
Using this concept, I draw a ‘projection trend line’ from the bottom or top of the impulse run thru the projected 78.6% price/time retracement value, to identify the price distribution structure in a linear form.
Now to introduce my STOP LOSS TRIANGLE.
This is a concept of decaying price and time as an underlying move towards our theoretical projection, where if the underlying enters our built faded cross-section, the SL is triggered to avoid sideways consolidation and decaying contract premiums.
This ‘right’ triangle that is ‘sclene’ by nature is created by taking the furthest projection in price/time symmetry (78.6%) and drawing a vertically placed straight line to the highest/lowest point in the rally previously identified. Here, I create a ‘right triangle’ by turning 90 degrees towards my final point, which is made by the nearest projection in price/time symmetry (38.2%). In its entirety, this forms the stop loss triangle.
Come follow me on X @askHVtobidIV for more!
CHEERS!

Bad News from NVDA and ASML Put Pressure on AI StocksTwo pieces of bad news hit the chip sector in a single day.
First, the U.S. announced new restrictions on Nvidia, blocking the sale of its H20 chip to China. H20 was the only AI chip Nvidia could legally sell to China under existing regulations. The company stated the new restrictions could cost up to $5.5 billion.
The second blow came from ASML’s earnings report. ASML is the sole producer of EUV machines, which are critical for manufacturing advanced chips, including those used in AI. ASML's revenue miss, combined with the Nvidia news, weighed heavily on technology stocks. However, there is a silver lining: the revenue miss was due to weaker DUV machine sales, which are used for more basic chips. EUV sales actually beat market expectations by 33.54%, indicating that investment in AI infrastructure remains strong.
Nvidia shares are down more than 6% in premarket trading. This downward pressure may continue after the market opens. If the price drops below 100, it could present a buying opportunity for medium- to long-term investors. AI investment continues globally, and countries outside the U.S. are likely to accelerate their efforts to catch up. Despite the recent negative sentiment, there is no major change in the long-term outlook for the sector.

Nvidia next possible move Hi traders what is your suggestion on this one?am looking at this bullish pennant and I believe it can breakes anytime soon note that this market is been controlled by economics n geopolitical this year soo far since Trump took the office he started trade war globally is not about who knows too much n who don't that's why you findout that things are going bek to were it was after tarrif is pause by that am saying everything we planned n analyst were good n moving accordingly until trade war started,that's the reason we don't only depend in analysis but in everything that is going on around the world wars,diseases n many more things does change very fast just make sure you are updated,soo I suggest you toom advantage of one company to own while they are pulling back don't fight with your mind mag 7 stocks they are all uptrend market don't be confused,understand pull back n were market is trending 😊 I wish you a profitable week

NVIDIA Chart with Advance Smart TP, SL, and EMA Trailing"Technical Analysis of This New Chart (NVIDIA 15-min, Heikin Ashi)
Setup:
Entry: 105.23
Forecast EMA: 103.02 (trending nicely upwards under the price = bullish support)
🧠 Key Observations:
The Forecast EMA result varies based on your settings and the selected chart timeframe."
Stop Loss: 99.97 (tight but safe under previous consolidation zone)
Take Profits:
TP1: 110.50 ✅
TP2: 115.76 ✅
TP3: 121.02 ✅
🧠 Key Observations:
Strong Breakout: You caught the move perfectly after a big consolidation phase (accumulation area visible).
Healthy Pullback: Small pullback after TP2 — healthy behavior, not a sharp reversal yet.
Forecast EMA Position: Price is well above Forecast EMA (103.02), and EMA is rising ➔ very bullish.
🛡️ Upgraded Trade Management Plan (for this chart):
1. If still holding the trade:
✅ Stop Loss Adjustment:
Now that TP1 (110.50) was hit, you should move Stop Loss up to your Entry (105.23) ➔ You are now risk-free.
2. Partial Take Profits Plan:
🎯 At TP2 (115.76):
➔ Sell 50% of remaining position.
➔ Activate a trailing stop for the rest.
🎯 At TP3 (121.02):
➔ Let the trailing stop follow.
➔ Tighten the trail after every new 15-min high is broken.
3. Trailing Stop Strategy After TP2:
📈 Trail the stop 2 bars behind the most recent swing low on the 15-min chart.
Example: If a candle makes a higher high and a higher low ➔ move stop 2 candles back to protect gains.
✍️ Special Notes:
If price suddenly drops and closes a full 15-min candle below Forecast EMA (103.02), it’s a sign momentum is weakening — you may want to close manually if that happens instead of risking trailing stop whipsaws.
Heikin Ashi candles make it easier to spot strong trends — watch for small-bodied candles (like dojis) at TP2/TP3 ➔ potential reversal signals.

NVDA walkthrough. NDOG+SMT Divergence. Intermarket CorrelationNASDAQ:NVDA
Pairing the NVDA and NQ to understand the direction of the expansion. Although IOF is enough with ES. But if you want to trade the stocks primarily you can use this

NVDIA Death Cross Quant Perspectives (Light Case Study)NASDAQ: Nvidia (NVDA ) has recently experienced an uptrend after a death cross formed consisting of the 65 and 200 EMAs on the 1 Day chart.
If we analyze back on Nvidia starting in 1999 , we can count a total of 10 death crosses that have occurred, and 9 have been immediately followed by downtrends. Although a single death cross did not have an immediate downtrend, shortly after this event (approx. 282 days) another death cross formed and price then fell roughly twice as it historically has , almost appearing to make up for the missed signal.
From a quantitative perspective:
If we calculate the raw historical success rate using:
Raw Success Rate = 9/10 = 90
With this calculation the observed success of 65/200 EMA death crosses correlating to an immediate downtrend is 90%
In order to avoid overconfidence we can apply Laplace smoothing using:
Smoothed Probability = 9+1/10+2 = 10/12 or 0.8333
With this calculation the observed success of 65/200 EMA death crosses correlating to an immediate downtrend is 83%
Given the results of the data I personally feel that there is a Very High (83%) chance this death cross that recently formed on the 1 Day chart (around 04/16/2025) will immediately lead to a downtrend. And a Low (17%) chance it does not. Furthermore these results support a technical analysis hypothesis that I formed prior.
Many different systemic factors can contribute to the market movement, but mathematics sometimes leave subtle clues. Will the market become bearish? Or will Nvidia gain renewed bullish interest?
Disclaimer: Not Financial Advice.

could break into mid 100Due to the room, it has to grow and the gap, plus the FVG, this could move and test high in the channel

Most people are saying $50... I think $65 after a little bounceI am seeing put open interest and volume spike for PUTS expiring 04/25 for a strike price of $55 that were opened YESTERDAY...
There is over 60,000 contracts open and rarely do these not play out.
It has been my long term target to hit $65 - $60 even before NVDA split there shares.
Lets see tho, the tape for options expiring in late June look bullish at the moment

How much is Nvidia worth next week?Nvidia is holding up a good 16% past the last post. I am currently neutral to the fact it has swung up and down and is now back to its price it was at last friday , $111.00 is ideal stable line average in 2%-3% either direction .The VIX is getting lower. If im bear i see potential for 3%-8% low(with no fear news).As for another up trending after consolidation a 5% - 12% gain ,high getting to $124.

$NVDA one more leg lower $58-76 targetNASDAQ:NVDA bounced off the lows at $86 but is now finding resistance, I think it's likely that we turn lower next week and start falling towards the targets below.
I think it's very likely that we make it down to the lower supports at $63-58 before we see a sustainable bounce form.
Let's see how it plays out over the coming weeks.

The Case for NVDA to 40As a prereq to this post it would be good to read my post on SMCI. In that I link to all the real time forecasts in SMCI of the methods we're using for the NVDA forecast.
And somewhat lay the groundwork for this post.
Click the post to read in full.
===#
So let's start with the big overview. NVDA for a long time has been trading inside of the risk zone for the end of wave.
Here's a forecast on NVDA when it was 500 (pre split)in which I mapped out the full extension of an Elliot wave.
Click the post to read in full.
In that post based on the assumption the previous rally was wave one we could make a forecast of a rally to around 800 - 900 and then some head fake action above 1,000.
I also put fibs on the chart and showed how this move would be a breaking of the 1.61 and a full extension to the 4.23.
As you can see, we're now sitting right at that big 4.23 level I brought up back in 2024.
Here's the thing spoken of in the SMCI top.
In that post I spoke about the tendency for move to end on spike outs of the 4.23 and they can make full retracements all the way to the 1.27 (or worse, in some cases - that's the bull setup).
The 4.23 is a big decision point. If NVDA held the 4.23 as support I'd be insanely bullish on this for the next couple years ahead. It'd be a huge win for the bulls I'd think.
However, if that was a head fake over the 4.23, you've seen the best you'll see from NVDA for a while. Indeed, we would be very close to entering the worst you've seen from it.

Nvidia Prepares For New All-Time High, Last Chance To Buy Low!The market always gives as second chance. This is a phrase that I love to share and it is true, it is confirmed here on this very chart.
The action for NVDA moved back down to produce a higher low —your second and last chance. This higher low is happening within a very strong buy-zone and this can mean the difference between massive profits or an opportunity that is lost. From here on, Nvidia will grow long-term set to produce a new All-Time High in the coming months.
The minimum target and price level for this rise stands around ~150 within 1-3 months. Then a correction and then higher, much higher... Up, up and up go we.
I can entertain you with tons of details I have the ability but I will not do so. I will go straight to the point.
» The next All-Time High and main target for this wave is 194, this can take a little more, or less, than 6 months.
What will happen next, we will have to wait to ask the chart.
It is my pleasure to write for you again.
Make sure to boost if you would like more updates.
If you boost and comment, we can move to daily updates as the market grow.
Go in, go now, buy-in and go LONG!
Nvidia is going up! Together with Bitcoin and the Altcoins.
Thanks a lot for your continued support.
Namaste.

$NVDA forming local higher low and above 20-Day SMA NASDAQ:NVDA has traded very poorly recently. Today we are looking at a daily price chart of NASDAQ:NVDA and we have seen many lower lows and lower highs since GTC Conference. After touching the ATH of 150 $, the price is making new lows and has recently touched the lows of 85 $ and made new higher low of 95 $. So, this marks a double higher bottom and now the at 105 $ is now above 20 Day SMA. This might mark a bullish reversal in my opinion.
So why not a trade idea on a Friday. #TGIF. I say we go long NASDAQ:NVDA here and now. Remain long if it remains over the 50-Day, 100-Day and 200-Day SMA. 200-Day SMA ist currently @ 125 $. If NVDA has a weekly close above 125 $ then we go all in on $NVDA.
Verdict: Long NASDAQ:NVDA here until 125 $. Keep watching this space for next levels.

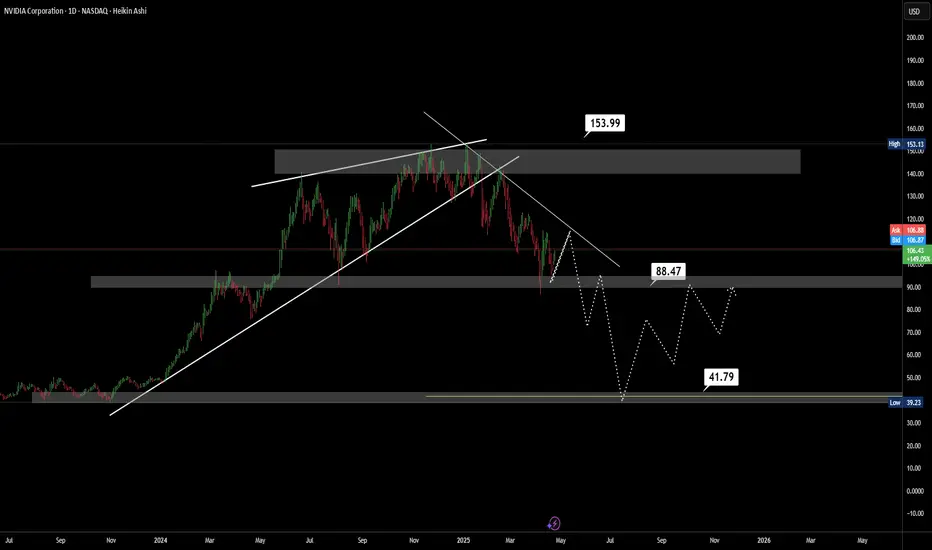
Bearish Continuation in PlayAfter an extended distribution phase near the premium zone and a clear break of the ascending channel, NVDA has shifted into a bearish market structure.
Price is currently pulling back into a key supply zone and retesting the bearish trendline. If this area holds, we could see further downside movement with the following targets:
🔻 $88.47 – potential support and short-term consolidation area.
🔻 $41.79 – medium-term target if bearish momentum continues and support breaks.
This bearish outlook remains valid as long as price stays below $153.99, which marks the invalidation level and the potential start of a bullish reversal.
🔍 Market structure is showing consistent lower highs and lower lows, confirming bearish pressure.