Lisk All-Time Low | 4,569% In 2017... What About 2025?Each time Lisk (LSKBTC) hits a new All-Time Low (ATL), a bullish wave follows.
➖ In 2017, the ATL led to a bullish wave of 4,569%.
➖ In 2021, the ATL led to a b-wave that was much smaller but still relatively strong, with total growth amounting to 743%
We have a new ATL now, in 2024.
What type of wave are we set to experience, similar to 2017 or 2021?
If we go by the law of alternation, which tends to play-out every single time, this wave should be a big one because the last one was a small one, relatively speaking.
More than 700% growth is actually pretty good but it can seen as small compared to 4,000%+.
The potential for 2025 goes to 785%-1,080% and even up to 2,397%... Right now we don't know if it will go higher or how exactly it will develop.
What we do know is that the market is not the same as it was years ago.
Cryptocurrency is now mainstream and growing every single day.
Based on early developments across the market, we are set to experience massive growth next year because institutional money is now also playing this game.
How will trillions of dollars injected into the market affect the Altcoins?
We do not know, but more capital tends to encourage all encompassing growth.
This is the BTC pair which makes it harder to predict a top.
We will look into the USDT pair soon to figure out how far up Lisk can go.
Remember to boost if you would like to see more.
Namaste.
LSKBTC trade ideas


✳️ Lisk Prepares For A Change Of Trend (150% Profits Potential) A trend change can translate into years of growth (long-term growth).
Right now Lisk (LSKBTC) is moving into the biggest bullish breakout since early 2023, a year ago.
This current move is supported by the highest volume in a year as well and a super strong RSI.
The daily RSI reading is set at 75 with prices coming out of major low.
This indicates that this is a very strong move.
We can easily see 150% profits as this pair grows as many, many others have done, short-term. Long-term growth potential can go much, much higher.
Thank you for reading.
Namaste.

LSK/BTC - Lisk: BBand Breakout◳◱ On the $LSK/ CRYPTOCAP:BTC chart, the Bband Breakout pattern suggests an upcoming trend shift. Traders might observe resistance around 0.00002999 | 0.00003259 | 0.00003675 and support near 0.00002583 | 0.00002427 | 0.00002011. Entering trades at 0.00002783 could be strategic, aiming for the next resistance level.
◰◲ General info :
▣ Name: Lisk
▣ Rank: 264
▣ Exchanges: Binance, Huobipro, Gateio, Bittrex, Kraken, Hitbtc
▣ Category/Sector: Infrastructure - Application Development
▣ Overview: Lisk is a blockchain application platform. Based on its own network and utility token LSK, Lisk aims to enable JavaScript developers to build blockchain applications and deploy their own sidechain linked to the Lisk mainchain, including a custom token. The network is operated using the Delegated Proof of Stake (DPoS) consensus algorithm.
◰◲ Technical Metrics :
▣ Mrkt Price: 0.00002783 ₿
▣ 24HVol: 6.234 ₿
▣ 24H Chng: 4.703%
▣ 7-Days Chng: -5.01%
▣ 1-Month Chng: 0.56%
▣ 3-Months Chng: 56.83%
◲◰ Pivot Points - Levels :
◥ Resistance: 0.00002999 | 0.00003259 | 0.00003675
◢ Support: 0.00002583 | 0.00002427 | 0.00002011
◱◳ Indicators recommendation :
▣ Oscillators: NEUTRAL
▣ Moving Averages: BUY
◰◲ Technical Indicators Summary : BUY
◲◰ Sharpe Ratios :
▣ Last 30D: 0.39
▣ Last 90D: 2.49
▣ Last 1-Y: 0.61
▣ Last 3-Y: 0.43
◲◰ Volatility :
▣ Last 30D: 1.00
▣ Last 90D: 0.79
▣ Last 1-Y: 0.75
▣ Last 3-Y: 1.12
◳◰ Market Sentiment Index :
▣ News sentiment score is N/A
▣ Twitter sentiment score is 0.43 - Bearish
▣ Reddit sentiment score is 0.73 - Bullish
▣ In-depth LSKBTC technical analysis on Tradingview TA page
▣ What do you think of this analysis? Share your insights and let's discuss in the comments below. Your like, follow and support would be greatly appreciated!
◲ Disclaimer
Please note that the information and publications provided are for informational purposes only and should not be construed as financial, investment, trading, or any other type of advice or recommendation. We encourage you to conduct your own research and consult with a qualified professional before making any financial decisions. The use of the information provided is solely at your own risk.
▣ Welcome to the home of charting big: TradingView
Benefit from a ton of financial analysis features, instruments and data. Have a look around, and if you do choose to go with an upgraded plan, you'll get up to $30.
Discover it here - affiliate link -

LSK/BTC - Lisk: Resistance_Breakout◳◱ A Resistance Breakout has been identified on the JSE:LSK / CRYPTOCAP:BTC chart. The price has broken above a key resistance level, indicating a potential bullish trend. The next resistance key levels are located at 0.00002827 | 0.00002996 | 0.000033, and the major support zones can be found at 0.00002523 | 0.00002388 | 0.00002084. Consider entering at the current price zone of 0.0000273 and targeting higher levels.
◰◲ General info :
▣ Name: Lisk
▣ Rank: 211
▣ Exchanges: Binance, Kucoin, Huobipro, Gateio, Poloniex, Bittrex
▣ Category/Sector: Infrastructure - Application Development
▣ Overview: Lisk is a blockchain application platform. Based on its own network and utility token LSK, Lisk aims to enable JavaScript developers to build blockchain applications and deploy their own sidechain linked to the Lisk mainchain, including a custom token. The network is operated using the Delegated Proof of Stake (DPoS) consensus algorithm.
◰◲ Technical Metrics :
▣ Mrkt Price: 0.0000273 ₿
▣ 24HVol: 1.030 ₿
▣ 24H Chng: 1.942%
▣ 7-Days Chng: -0.82%
▣ 1-Month Chng: 17.32%
▣ 3-Months Chng: -26.80%
◲◰ Pivot Points - Levels :
◥ Resistance: 0.00002827 | 0.00002996 | 0.000033
◢ Support: 0.00002523 | 0.00002388 | 0.00002084
◱◳ Indicators recommendation :
▣ Oscillators: NEUTRAL
▣ Moving Averages: STRONG_BUY
◰◲ Technical Indicators Summary : STRONG_BUY
◲◰ Sharpe Ratios :
▣ Last 30D: 0.82
▣ Last 90D: -2.56
▣ Last 1-Y: -0.42
▣ Last 3-Y: 0.31
◲◰ Volatility :
▣ Last 30D: 0.70
▣ Last 90D: 0.58
▣ Last 1-Y: 0.78
▣ Last 3-Y: 1.15
◳◰ Market Sentiment Index :
▣ News sentiment score is N/A
▣ Twitter sentiment score is 0.43 - Bearish
▣ Reddit sentiment score is 0.75 - Bullish
▣ In-depth LSKBTC technical analysis on Tradingview TA page
▣ What do you think of this analysis? Share your insights and let's discuss in the comments below. Your like, follow and support would be greatly appreciated!
◲ Disclaimer
Please note that the information and publications provided are for informational purposes only and should not be construed as financial, investment, trading, or any other type of advice or recommendation. We encourage you to conduct your own research and consult with a qualified professional before making any financial decisions. The use of the information provided is solely at your own risk.
▣ Welcome to the home of charting big: TradingView
Benefit from a ton of financial analysis features, instruments and data. Have a look around, and if you do choose to go with an upgraded plan, you'll get up to $30.
Discover it here - affiliate link -

LSKBTC (Lisk)Yes, as I was saying, especially since there have been a few consecutive winning rounds with this LSK, I will apply the same method of buying as it falls towards 0.00001500 and then sell it when it has a jump of at least 30% above the average of previous purchases. It's a matter of patience, it's not easy to put a significant budget at stake. That's why it's good not to be too impulsive, but at the same time to be an active and satisfied participant in the crypto space. Especially in turbulent times. Have a wonderful day!

LSK (Lisk)I have to prove myself the strategy of DCA on a list of altcoins. Therefore I'll take LISK again on this purpose.
I will cover 75% of a downturn with a min 30% winning target.
It seems to be a nice way trading aside of this boring BTC evolution.
What do you think?
Regards.

$LSK/#BTC [#Lisk]: BBand_Breakout Hey traders, we've identified a Bollinger Band breakout on the $LSK / $BTC chart. The price has moved outside of the upper Bollinger Band, which can indicate a potential bullish trend. The next resistance key levels are at 0.00006245 | 0.00007673 | 0.00009923 and the major support zones are respectively at 0.00003995 | 0.00003173 | 0.00000923. We may consider buying at the current price zone 0.00004804 and targetting higher levels.
Technical Metrics :
Current price: 0.00004804
24H Volume: 9.1235 Ƀ
24H Price change: 6.26%
- Pivot Points - Levels :
Resistance: 0.00006245 | 0.00007673 | 0.00009923
Support: 0.00003995 | 0.00003173 | 0.00000923
Indicators recommandation :
Oscillators: BUY
Moving Averages: STRONG_BUY
Technical Indicators Summary : BUY
- In-depth LSKBTC technical analysis on > Tradingview TA page
What do you think of this analysis? Share your insights and let's discuss in the comments below. Your like, follow and support would be greatly appreciated!
Welcome to the home of charting big: TradingView
Benefit from a ton of financial analysis features, instruments and data. Have a look around, and if you do choose to go with an upgraded plan, you'll get up to $30.
Discover it here

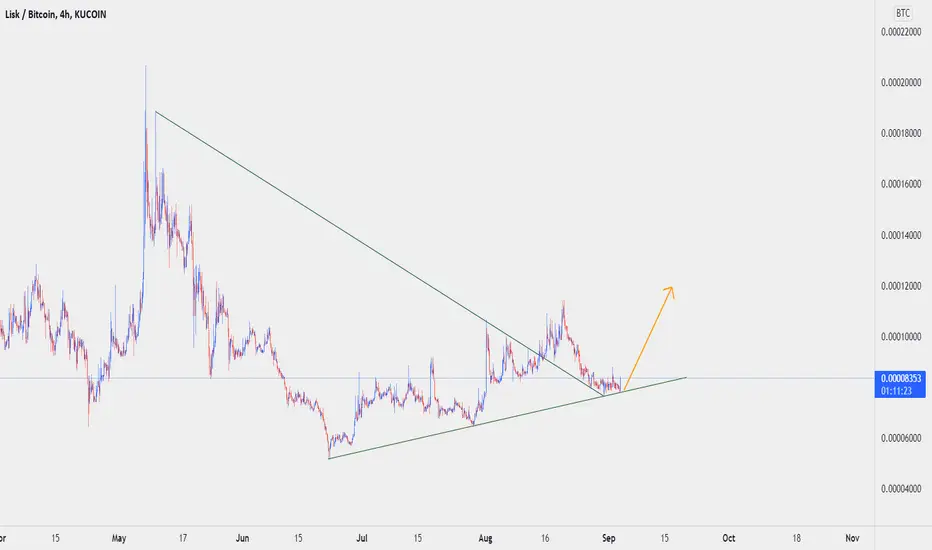
Lisk has a big perspective this yearThis year will be broken downtrend channel. Lisk will be announce big changes in the protocol

LSK (Lisk)I pick LSK/BTC pair here. In my opinion LSK has real potential for growth. It has dropped since May'21 almost 84%.
It had two attempts to the upside with more than 50% each, being a good sign for me eventually.
RSI 1D > 70, being in the overbought area.
Kind regards 🫶🏻

Lisk vs Bitcoin | Reading The Chart SignalsWe are going to be focusing on the chart signals for LSKBTC.
1) We have a Falling Wedge Pattern (blue).
2) In this same pattern we also have a broken downtrend line. You always have a downtrend line with the falling wedge.
3) Long-term higher low (Jan. 2021 - Feb. 2022).
4) Volume breakout.
5) Break above EMA10/EMA50.
6) Entire Cryptocurrency market going bullish.
7) MACD above zero.
8) RSI at 64.
9) Bullish divergence MACD & RSI (Feb.)
All these are bullish signals.
There are no bearish signals currently on this chart.
More signals can be extracted from higher/lower timeframes as well as different charting systems.
We use a combination of signals rather than just one before making a call.
We look for at least 3-5 strong bullish signals, the rest we can ignore.
If we see mixed signals.
If we have mixed feelings.
If doubts creep in while reading a chart, we move on.
There are always more opportunities.
So anything that causes doubt means that the chart setup isn't strong enough.
Even with 100 bullish signals and 100% certainty/confidence, we still map the bearish scenario, support levels and when trading use a MANUAL stop-loss.
Namaste.

Lisk vs Bitcoin Bullish Breakout Confirmed (100%+ Potential)Less than two days ago we looked at Lisk vs Bitcoin (LSKBTC) together... We looked at so many signals and the bullish break is now confirmed...
Previous trade idea below:
Prices are moving above EMA100 and the indicators are looking stronger... We can say a change of trend is certain now, we are looking at additional growth.
The targets are mapped on the chart.
Enjoy.
Namaste.


Re entry LSKLow volume on binance just need some boost,
this is my second entry
hope to not be stoped

LISK LSK / BTC has reached possible bottomRecovery rally will really start getting momentum as we go into 2022.

LISK buy signal &targetsI also remembered LISK now, from the older coins category. Did not want to miss that
So here it is.
I will keep you updated as always!
Other old coins to keep in mind (may pump):
NXS
NAS
VIB - had a mini pump
QKC - had a mini pump
AMB - had a mini pump (may go lower5-7%)
BNT
MFT - may pump soon
GXS - another old one
OAX - may go lower 3-5%
just check them out on www.tradingview.com (example)
Strong buy - watches

LSK Bounce PlayHere's a possible bounce play for LSK against BTC. Hidden Bullish Continuation Divergence.


Lisk | This Is What I Call A Volume Breakout + Bullish Cross Ex.To have a "volume breakout" the daily volume doesn't necessarily needs to be big/strong, it just needs to be above-average for several weeks.
Notice the chart above...
Today's volume bar is the highest volume bar we've had on the LSKBTC chart since 26-May, that's over 4 weeks.
A volume breakout can signal that the trend is about to change.
Now, we also have the MACD bullish cross.
Here is the chart:
The blue line we call MACD.
The orange line we call Signal.
When the MACD crosses up the Signal line we have the bullish cross.
Also notice the histogram going green.
This can signals that the MACD is about to move higher which can translate to higher prices...
The charts are always changing of course, so if you were to trade, you need to have a plan developed BEFORE buying any coins.
Thanks for reading all the way to the end.
I hope you are learning/being entertained.
Namaste.


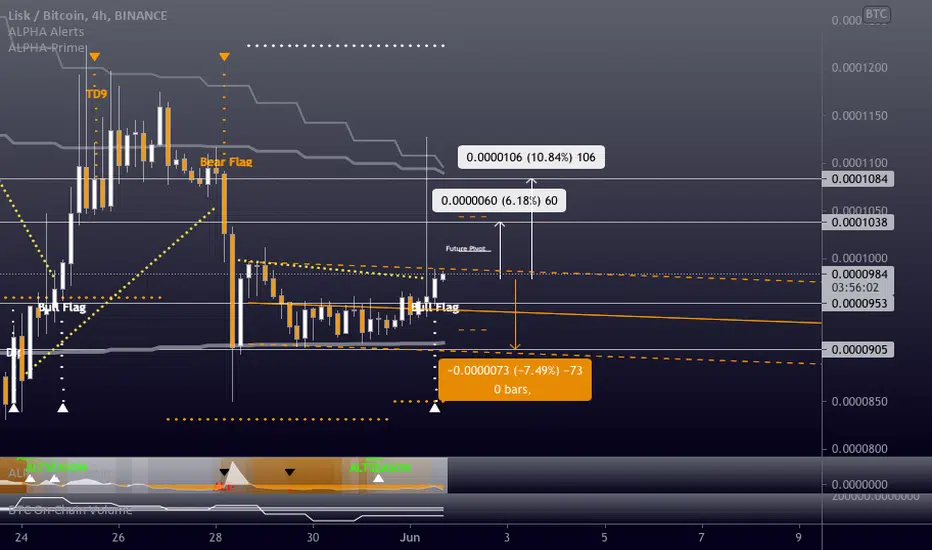
LSKBTC - Long - Potential 10.85%LSKBTC - Long - Potential 10.85%
Exchanges: Binance
Signal Type: Regular (Long)
Entry Zone:
0.0000953 - 0.0000978
Take-Profit Targets:
1) 0.0001038
2) 0.0001084
Stop Targets:
1) 0.0000905
Trailing Configuration:
Entry: Percentage (0.0%)
Entry Triggers- Bullflg Breakout and Bullish future pivot.