LISKBTCLISKBTC, tant qu'il crée pas un nouveau canal ascendant il a rien d'acheteur à part le MACD et deux rejet d'un support mineur. à voir comment il fait avec les 78%
LSKBTC trade ideas

LSKBTC WILL FLYAccording to 1 day timeframe, we can see long lower shadow closed above MA50 and continued to bullish. and if we chang the tf to 4h, we can see it will make a reverse head and shoulders.

LSK/BTC (Bullish Triangle Pattern?)LSK/BTC
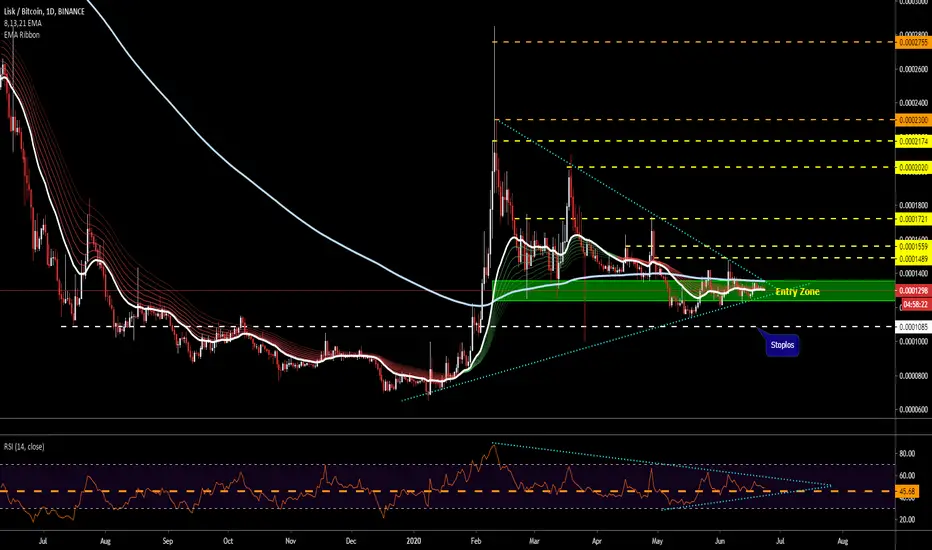
-we can see a clear rejection of flat area of resistance at 1400
-the price pullback to the 50ma dynamic support range
-bulls keep a series of higher lows which will give potential breakout
-technically, it is forming a bullish ascending triangle
-a confirmation upside breakout is the only thing we are waiting
-the potential upside target is up to 1700-2000 range or higher
-invalidating my bullish bias if the ascending trendline is broken down


LSK is Converging and ready for Breakout1.LSK has broken the resistance of trend line. The trend started from 10 Feb 2020. And it has broken the trend line.
2. Also there is a daily support which has been tested and rejected indicating a strong support.
3. 1310 is the daily support level and is a good spot to enter the long trade.

LSK LongCheck my July Track Record and see if it makes sense for you.. I did VETBTC & ATOMBTC. Waiting for QKCBTC. Now ATOMBTC earnings added into this trade. Long LSK, I ve put my exact position, target and SL.

VIDEO: LSK • LISK • LISKBTC • LISKUSDLisk offering high probability swing trade here. Watch video for my thoughts on it


Fibonacci reform in the region 55 to 65%Hello friends
High price of conversion line
Stochastic indicators are also in maximum sales
P.S. as I don't use like-bots and other solutions that show great "interest" to my posts, I will be grateful if you support my work by your LIKEs and comment. Of course, if you can do it. The feedback from REAL people is priceless!
Disclaimer!
This post does not provide financial advice. It is for educational purposes only! You can use the information from the post to make your own trading plan for the market. But you must do your own research and use it as the priority. Trading is risky, and it is not suitable for everyone. Only you can be responsible for your trading.

$LSK / BTC Long | Touching Weekly Downward ResistanceIf / when $LSK can break through this resistance my first target would be a ~+200% gain.


LSK - Bullish Breakout of Wedge, Big Gains AheadPretty simple TA here. Bullish breakout with a bullish daily MACD. The key level to beat is the .00014 level. This level acted as strong support from February till May and then it fell below and got trapped. I am watching for the breakout beyond the blue price level. This would be a strong buy signal.


Lisk BTC with 900% potential swingLisk has bottomed and is currently in the accumulation phase in Weekly Demand, A big move is coming and once this moves, it will move! Well worth keeping in the Portfolio


LSKBTC looks very bullish expecting at list 50%#LSKBTC is very good buy and hold right now!
price at this moment: 0.0001298
i am buying between 0.0001200 -1280
My targets for short term: 0.0001489 - 1559 - 1721 - 2020 - 2174
Midterm: 2300- 2755
StopLoss : 0.0001080