Litecoin Bull Market Bullish Wave Now In The MakingUsing the leverage or not will really depend on what you buy. Bitcoin is trading right now almost at 100K and very close to its All-Time High but this isn't the case for Litecoin or other Altcoins.
Not all your capital should be used for leverage or spot, it can be divided a portion here and a portion there, it is not black or white there is a full color spectrum to choose from and each color have a huge range of gradation. Think about that one for a minute.
If you have to ask the question, "Can I use leverage now?" the answer is always no. The person that can use it don't need to ask. If you have to ask means that you are not prepared or don't know what to expect. Since it is risky and the game is not only the first step, it is better to be prepared.
Using leverage, you can have positions open and "winning" for months and when correction time comes, one mistake can lead to the next until the whole house of cards breaks down and you are left with nothing. It is a complex game to say the least. Learning of course requires practice and for success it is very important to have great entry price and right timing.
How you choose to trade is up to you.
Maybe nobody can beat index funds with compounded interest after tax for 20 years straight or with billions of dollars but individually it can be done in so many ways. It can be done and has been done a countless number of times for 3 years, 5 years, 10 years, 15 years and so on. You don't need a lifetime of this system you just need a big hefty profit and continue with a strategy that adapts to market conditions as you trade and grow.
Investing is not the same as trading. Investors always vouch for buy and hold and do nothing, but trading can be a great asset yet requires work and big money makes it harder, and harder it becomes the bigger the pot.
Individually, as in us, we can make a fortune easy with the right timing, mindset and buy and hold. Buy near the bottom of the bear market or a strong correction. It doesn't have to be the perfect bottom, can be just close and even months away. Sell when prices are high or going up. It doesn't have to be the top nor the exact All-Time High date.
If we can put our capital to grow between 200-500% within each cycle with Crypto, we are not talking billions as we are all small, we can make millions of times more profits than choosing stocks or the investor favorite stock index funds.
The index funds are paying less and less with each passing decade. Crypto is here to shake things up a little bit. A breath of fresh air.
We can go back to high earnings, high profits with very little effort and easy enough that anybody who invest time to actually studying the systems will get their moneys worth. The stock market is so 1950s... Crypto is the future of finance, I don't think there is any doubt anymore.
As long as your money is in the market, you will win long-term.
Namaste.
LTCBULLUSDT trade ideas

Litecoin (LTC): Sellers Are Taking Over | Breakdown IncomingLitecoin is seeing a strong dominance from sellers, where recently we filled one of the major CME gaps that was of concern for us. Now we might actually go for a breakdown here and get a nice 1:3 RR setup from it.
More in-depth info is in the video—enjoy!
Swallow Academy

LTCUSDTLite coin is ready for another push to the upside
This is not in anyway a financial advice, pls apply proper risk management

Litecoin Breakout And Potential RetraceHey Traders, in today's trading session we are monitoring LTCUSDT for a selling opportunity around 85 zone, Litecoin was trading in an uptrend and successfully managed to break it out. Currently is in a correction phase in which it is approaching the retrace area at 85 support and resistance area.
Trade safe, Joe.

LTC Mid Term Analysis As far as I can see, Litecoin is still moving within a wide channel that has remained reliable for years.
If you ignore the volatility and short-term fractals, Litecoin has consistently provided profits to early investors who were patient enough to wait.
Before this summer, I anticipate that LTC will reach at least $100 to $106.
The main target should be much higher, but predicting the future is a bit more difficult at the moment.
Due to new U.S. policies and other fundamental events, the target price should be kept at moderate levels for now.

LITCOIN SIGNALSHello dears
You see that after a good growth, the price was in a range and then we had a decline until the support area was identified, which is also a good area and it was able to record a new ceiling, which is a good sign. Now the best and least risky thing is to buy steps.
We have identified the buying steps for you and the targets...
Note that this analysis is in daily time and may take a while, so if you are not patient, do not enter.
*Trade safely with us*

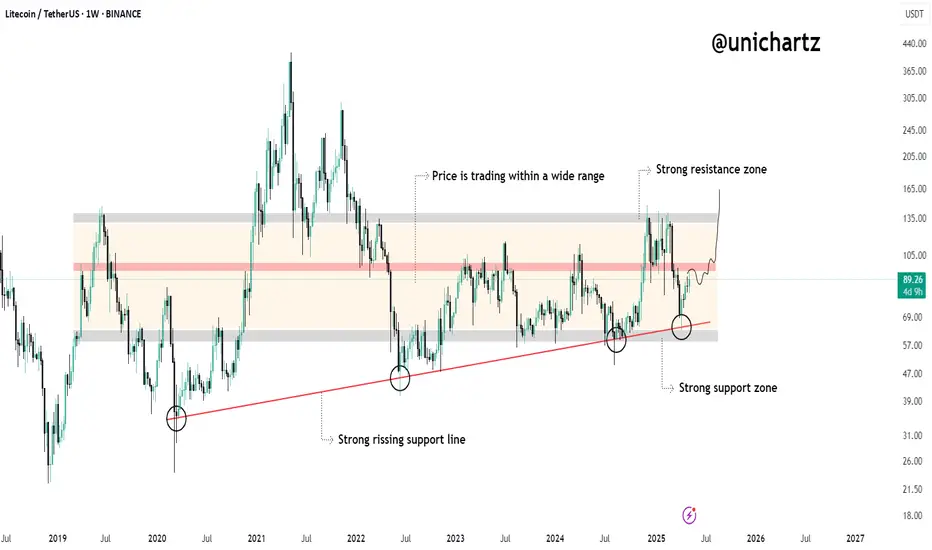
Is $LTC Lining Up for a Breakout Move?LTCUSDT is moving inside a wide range that's been respected for over 3 years — with price bouncing between a strong support zone ($50–$60) and a strong resistance zone ($130–$145).
Key Highlights:
Strong Support Zone:
Price recently bounced off a long-term horizontal support area near $60 — the same zone that sparked multiple rallies in the past.
Rising Trendline:
A clean, rising diagonal support has held since 2020 — each retest has led to upward momentum. The latest bounce confirms this structure is still valid.
Current Structure:
Price is climbing from the base of the range. If it breaks through the mid-zone and holds, we could see an attempt toward the upper resistance around $130+.
DYOR, NFA
#LTCUSDT: On The Way To $200, Get Ready For Swing Buy! Hey there!
Evening Everyone,
The price of this crypto is currently in a bullish formation, and it looks like it’s on the rise, potentially reaching $200. The best thing you can do is wait for the price to break out of the downtrend and then keep going up. You could set a target at $150 and then $200, which would be a swing move.
Good luck and trade safely! 😊
Thanks a bunch for your unwavering support! ❤️🚀
If you’d like to lend a hand, here are a few ways you can contribute:
- Like our ideas
- Comment on our ideas
- Share our ideas
Cheers,
Team Setupsfx_

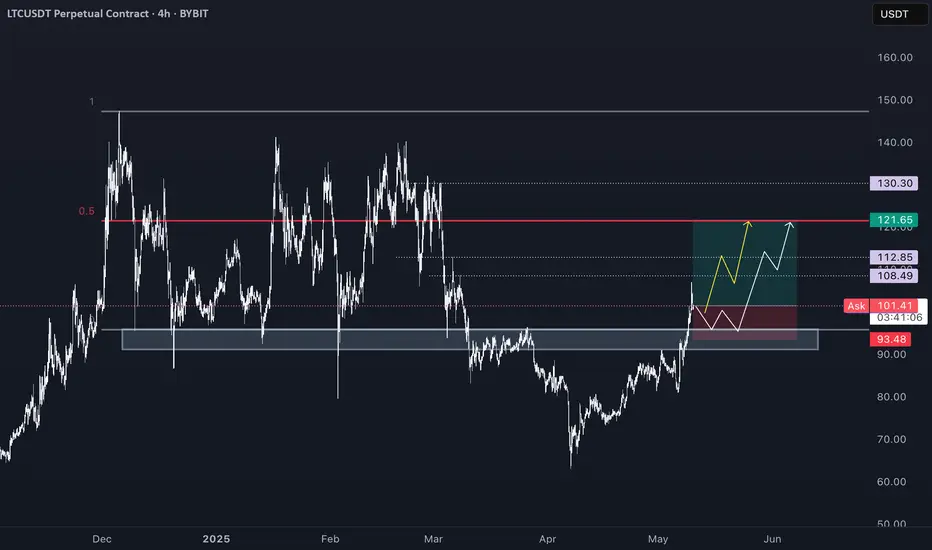
Bullish on Litecoin: Targets Set at $135 and $145Litecoin (LTC) is showing strong signs of a bullish reversal after a sustained period of consolidation and a failed breakdown from a critical support level. The price recently bounced from the strong support zone at $62.97, confirming this level as a reliable base. Notably, the asset failed to break below this support, suggesting accumulation and potential for upward momentum.
Currently, LTC is trading around $87, just above the local resistance and forming a bullish structure. A clear breakout above this region could trigger a strong upward move toward the next resistance target of $135.43, and potentially the second target at $145.46, which aligns with a historical resistance level.
A well-placed long trade setup is visible:
Entry Point: $87.04
Stop Loss: $74.66 (approx. -14.80% risk)
Take Profit: $135.43 (approx. +54.55% potential upside)
This trade offers a favorable risk-to-reward ratio of 3.69, making it attractive for bullish traders.
The MACD indicator below the chart is also showing early bullish crossover signals, with the MACD line approaching a break above the signal line. If this momentum continues, it would further support the bullish outlook.
Fundamental Insight: Why Litecoin Has Long-Term Potential
Litecoin offers several key technical differences compared to Bitcoin:
Faster transaction speed: 2.5-minute block time vs. Bitcoin’s 10 minutes
Lower transaction costs
Uses Scrypt instead of SHA-256 for its proof-of-work consensus
Larger maximum supply: 84 million vs. Bitcoin’s 21 million
Positioned as the "silver" to Bitcoin's "gold," Litecoin serves as a faster, more scalable alternative in real-world transactions. With its four-year halving cycle, similar to Bitcoin, and historical resilience, LTC continues to be a solid mid-cap crypto asset for long-term holders.

LTC Breakout : $93 Battle Could Unleash $97-$100 Surge!🔥 LTC Breakout Alert! 🚀 Litecoin is battling resistance at $93—smash through and hold, and we’re eyeing a massive jump to $97-$100! 📈 This could be the perfect long setup if it sticks! Don’t miss out, traders—watch closely! 👀💥

LTCUSDTThe current outlook on $LTCUSDT.
This is not in anyway a financial advice, pls apply proper risk management

LTCUSDT | Long Bias | Major Support | (May 12, 2025)LTCUSDT | Long Bias | Major Support + Spot Buy Interest | (May 12, 2025)
1️⃣ Short Insight Summary:
Litecoin has been in a long downtrend since 2021, but price action is now approaching a major historical support zone. Spot buyers are stepping in, and this could set up for a strong bounce if confirmed.
2️⃣ Trade Parameters:
Bias: Long
Entry: Around $90–$92 (support zone near the bottom of the parallel channel)
Stop Loss: Below $90 or structure invalidation
TP1: $125
TP2: $144
Final TP: $181–$267 (for optimistic scenario)
Partial Exits: Recommended at each target level
3️⃣ Key Notes:
✅ Price is at the lowest levels seen since the major drop, with spot interest building up—potential signal for a bottoming move.
✅ We're currently moving within a parallel channel, and the lower band is acting as strong support.
✅ 12-hour chart shows the most relevant structure, and volume shows early signs of potential accumulation.
❌ Confirmation is still needed—watch for strong bullish reaction or high-volume push to validate the entry.
4️⃣ Optional Follow-up Note:
Will be watching closely to see if the $90–92 zone holds and shows strength. Plan is to enter long there and manage risk through partial take-profits.
Please LIKE 👍, FOLLOW ✅, SHARE 🙌 and COMMENT ✍ if you enjoy this idea! Also share your ideas and charts in the comments section below! This is best way to keep it relevant, support us, keep the content here free and allow the idea to reach as many people as possible.
Disclaimer: This is not financial advice. Always conduct your own research. This content may include enhancements made using AI.

LTC long Range reclaim, onto range mid or back down to range lows build a base and pump from there, weekend trade
LTC Long - Learn to read Weis Wave with SI- Target hit overnightLearning to read the chart using Weis Wave with Speed Index will help you understand how the market works. Speed Index is very valuable to understand if there is absorption happening in the market. Remember that absorption takes time, it takes hours or sometimes days, so you have to be patient. In this chart I will explain how to read this 1HR LTC chart using Speed Index and why we had this explosion in price. I have entered long (my target was hit overnight). Annotations on chart are in sync with my below notes.
Reading:
1. We had a high volume down move (buyers could be in there but I am not sure yet)
2. We have touched 50-61.8 Fib area - If buyers would like to enter this is a great area.
3. Speed Index 29 that's an Abnormal Speed Index. Why is it abnormal? Because at that time the average Speed Index of 30 waves back was 15. I call this as the first Push or the first absorption. Buyers are entering.
4. Speed Index 78.7 another abnormal SI -> more buying
5. Speed Index 37 on a down wave that's what I call a HTMD (Hard to move down) more buying and finally a PL (Plutus Long signal) breaking by a bit the previous resistance level. This is where I have Entered Long.
6. Another HTMD , hard to move down wave with Speed Index 32.2, more buying and another Plutus long signal PRL.
Therefore the explosion is completely justified because it has a history of several hours of absorption. If you were to read just volume waves you would not be able to see this coming Speed Index alerts that something is cooking and when the time is right you enter (PL signal)
I hope my above explanations helped you.
Enjoy!

LTCUSDTLTC/USDT Bullish Weekly Setup:
Timeframe: Weekly
Trend: Bullish
Entry: 70.88
Target: $130+
Stop Loss: 49.77
Litecoin (LTC) has been showing a consistent uptrend on the weekly timeframe, with the price forming higher highs and higher lows

Litecoin just broke every major EMA on the D1 — in one candle.LTC just broke every major EMA on the D1 — in one candle.
Reversal confirmed. Momentum ignited.
$100 is the new battleground.
Break and hold → next stop $120–$130
Don’t sleep on #Litecoin

The key is whether there is support near 95.73
Hello, traders.
If you "Follow", you can always get new information quickly.
Please also click "Boost".
Have a nice day today.
-------------------------------------
(LTCUSDT 1D chart)
The key is whether the price can be maintained above the M-Signal indicator on the 1M chart.
Accordingly, the key is whether there is support near 95.73.
If it fails to rise, you should check whether there is support near 79.84.
In order for the stepwise uptrend to begin, it is likely to start by rising above 113.39.
If you are trading LTC, you should check whether there is support near 95.73 and create a trading strategy.
-
Thank you for reading to the end.
I hope you have a successful trade.
--------------------------------------------------
- Here is an explanation of the big picture.
I used TradingView's INDEX chart to check the entire range of BTC.
I rewrote it to update the previous chart while touching the Fibonacci ratio range of 1.902(101875.70) ~ 2(106275.10).
(Previous BTCUSD 12M chart)
Looking at the big picture, it seems to have been following a pattern since 2015.
In other words, it is a pattern that maintains a 3-year bull market and faces a 1-year bear market.
Accordingly, the bull market is expected to continue until 2025.
-
(Current BTCUSD 12M chart)
Based on the currently written Fibonacci ratio, it is displayed up to 3.618 (178910.15).
It is expected that it will not fall again below the Fibonacci ratio of 0.618 (44234.54).
(BTCUSDT 12M chart)
Based on the BTCUSDT chart, I think it is around 42283.58.
-
I will explain it again with the BTCUSD chart.
The Fibonacci ratio ranges marked in the green boxes, 1.902 (101875.70) ~ 2 (106275.10) and 3 (151166.97) ~ 3.14 (157451.83), are expected to be important support and resistance ranges.
In other words, it seems likely that they will act as volume profile ranges.
Therefore, in order to break through these ranges upward, I think the point to watch is whether they can receive support and rise near the Fibonacci ratios of 1.618 (89126.41) and 2.618 (134018.28).
Therefore, the maximum rising range in 2025 is expected to be the 3 (151166.97) ~ 3.14 (157451.83) range.
In order to do that, we need to see if it is supported and rises near 2.618 (134018.28).
If it falls after the bull market in 2025, we don't know how far it will fall, but based on the previous decline, we expect it to fall by about -60% to -70%.
Therefore, if it starts to fall near the Fibonacci ratio 3.14 (157451.83), it seems likely that it will fall to around Fibonacci 0.618 (44234.54).
I will explain more details when the bear market starts.
------------------------------------------------------

Litecoin LTC price analysis“By hook or by crook,” they are trying to keep the price of #LTC upper to the blue trend line, which has been in place since 2019.
On this chart, we have depicted horizontal and dynamic Fibo levels, and they are working well.
1️⃣ If the OKX:LTCUSDT price stays above $75, it will be a strong signal that it's time to go up.
2️⃣ If the #LTCUSD price drops to $66-68, it will be back on the trend line and will fight for the right to exist.
3️⃣ It would seem that a few dollars of difference, but the prospects are radically different.
In general, I'd like to see #Litecoin at least at $165-175.
_____________________
Did you like our analysis? Leave a comment, like, and follow to get more

Litecoin (LTC) Lesson 15 said - This is How to Read the ChatLesson 15 Methodology Chart Reading:
1. Highest up volume wave (sellers could be there)
2. Placed AVWAP lines at the beginning of the wave
3. Wait for price to cross downward AVWAP line
4. Pull back with an Abnormal Speed Index of 24.1S , that's a hard to move up, meaning sellers are absorbing on the up move
5. Enter Short on a Plutus signal which in this case is a double signal WS (Wyckoff Spring) and PRS (Plutus Reversal Short)
Enjoy!!!

LTC/USDT "Litecoin vs Tether" Crypto Heist Plan (Day/Swing)🌟Hi! Hola! Ola! Bonjour! Hallo! Marhaba!🌟
Dear Money Makers & Robbers, 🤑 💰💸✈️
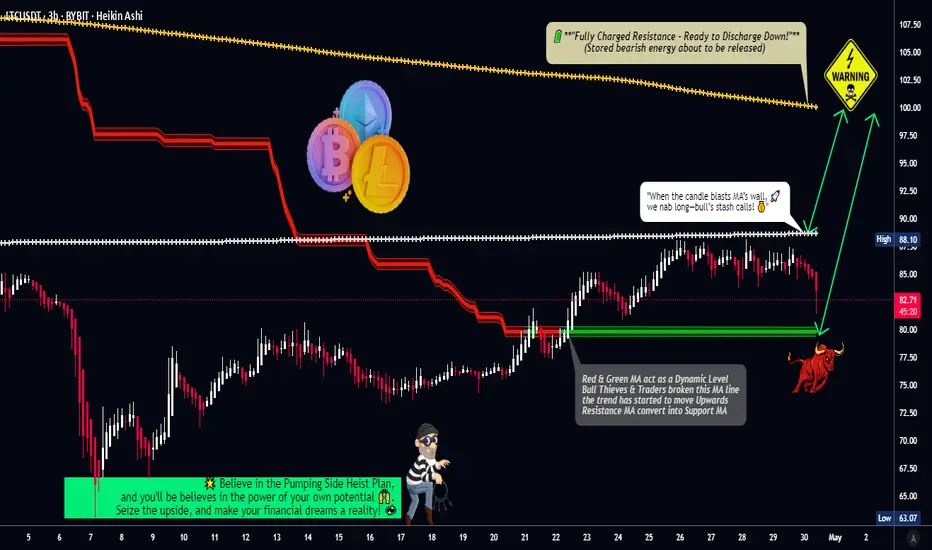
Based on 🔥Thief Trading style technical and fundamental analysis🔥, here is our master plan to heist the LTC/USDT "Litecoin vs Tether" Crypto Market. Please adhere to the strategy I've outlined in the chart, which emphasizes long entry. Our aim is to escape near the high-risk Yellow MA Zone. Risky level, overbought market, consolidation, trend reversal, trap at the level where traders and bearish robbers are stronger. 🏆💸"Take profit and treat yourself, traders. You deserve it!💪🏆🎉
Entry 📈 : "The heist is on! Wait for the MA breakout (90.00) then make your move - Bullish profits await!"
however I advise to Place Buy stop orders above the Moving average (or) Place buy limit orders within a 15 or 30 minute timeframe most recent or swing, low or high level for Pullback entries.
📌I strongly advise you to set an "alert (Alarm)" on your chart so you can see when the breakout entry occurs.
Stop Loss 🛑: "🔊 Yo, listen up! 🗣️ If you're lookin' to get in on a buy stop order, don't even think about settin' that stop loss till after the breakout 🚀. You feel me? Now, if you're smart, you'll place that stop loss where I told you to 📍, but if you're a rebel, you can put it wherever you like 🤪 - just don't say I didn't warn you ⚠️. You're playin' with fire 🔥, and it's your risk, not mine 👊."
📍 Thief SL placed at the nearest/swing low level Using the 3H timeframe (77.50) Day / Swing trade basis.
📍 SL is based on your risk of the trade, lot size and how many multiple orders you have to take.
🏴☠️Target 🎯: 100.00 (or) Escape Before the Target
🧲Scalpers, take note 👀 : only scalp on the Long side. If you have a lot of money, you can go straight away; if not, you can join swing traders and carry out the robbery plan. Use trailing SL to safeguard your money 💰.
💰💵💸LTC/USDT "Litecoin vs Tether" Crypto Market Heist Plan (Swing/Day) is currently experiencing a bullishness,., driven by several key factors. .☝☝☝
📰🗞️Get & Read the Fundamental, Macro, COT Report, On Chain Analysis, Sentimental Outlook, Intermarket Analysis, Future trend targets... go ahead to check 👉👉👉🔗🔗🔗
⚠️Trading Alert : News Releases and Position Management 📰🗞️🚫🚏
As a reminder, news releases can have a significant impact on market prices and volatility. To minimize potential losses and protect your running positions,
we recommend the following:
Avoid taking new trades during news releases
Use trailing stop-loss orders to protect your running positions and lock in profits
💖Supporting our robbery plan 💥Hit the Boost Button💥 will enable us to effortlessly make and steal money 💰💵. Boost the strength of our robbery team. Every day in this market make money with ease by using the Thief Trading Style.🏆💪🤝❤️🎉🚀
I'll see you soon with another heist plan, so stay tuned 🤑🐱👤🤗🤩
Litecoin (LTC): Looking For Break of Structure | Downward MoveLitecoin has a good chance of showing us some decent drops in the upcoming weeks so we are looking for a proper break of structure for now!
More in-depth info is in the video—enjoy!
Swallow Academy

LTCUSDT 1D AnalysisLTC ~ 1D Analysis
#LTC Buy after successfully penetrating this resistant line with a short -term target of at least 10%+ from here.

Valuable Demand Zone Amid Weak Market ConditionsLTCUSDT Analysis: Valuable Demand Zone Amid Weak Market Conditions
I believe the blue box in LTCUSDT is highly valuable as a demand zone. Given the overall market conditions are not strong , I’ve identified a lower entry point that aligns with more favorable risk-reward scenarios.
This blue box stands out due to its significance from multiple perspectives . I used heatmap , cumulative volume delta (CVD) , and volume footprint techniques to accurately define this zone as a potential buyer area.
Key Points:
Market Conditions: Currently weak, favoring conservative entry levels.
Blue Box: A carefully identified high-value demand zone.
Techniques Used: Heatmap, CVD, and volume footprint for precise demand mapping.
If you'd like to learn how I use these advanced techniques to define accurate demand zones, just DM me!
If you think this analysis helps you, please don't forget to boost and comment on this. These motivate me to share more insights with you!
I keep my charts clean and simple because I believe clarity leads to better decisions.
My approach is built on years of experience and a solid track record. I don’t claim to know it all, but I’m confident in my ability to spot high-probability setups.
If you would like to learn how to use the heatmap, cumulative volume delta and volume footprint techniques that I use below to determine very accurate demand regions, you can send me a private message. I help anyone who wants it completely free of charge.
My Previous Analysis
🐶 DOGEUSDT.P: Next Move
🎨 RENDERUSDT.P: Opportunity of the Month
💎 ETHUSDT.P: Where to Retrace
🟢 BNBUSDT.P: Potential Surge
📊 BTC Dominance: Reaction Zone
🌊 WAVESUSDT.P: Demand Zone Potential
🟣 UNIUSDT.P: Long-Term Trade
🔵 XRPUSDT.P: Entry Zones
🔗 LINKUSDT.P: Follow The River
📈 BTCUSDT.P: Two Key Demand Zones
🟩 POLUSDT: Bullish Momentum
🌟 PENDLEUSDT.P: Where Opportunity Meets Precision
🔥 BTCUSDT.P: Liquidation of Highly Leveraged Longs
🌊 SOLUSDT.P: SOL's Dip - Your Opportunity
🐸 1000PEPEUSDT.P: Prime Bounce Zone Unlocked
🚀 ETHUSDT.P: Set to Explode - Don't Miss This Game Changer
🤖 IQUSDT: Smart Plan
⚡️ PONDUSDT: A Trade Not Taken Is Better Than a Losing One
💼 STMXUSDT: 2 Buying Areas
🐢 TURBOUSDT: Buy Zones and Buyer Presence
🌍 ICPUSDT.P: Massive Upside Potential | Check the Trade Update For Seeing Results
🟠 IDEXUSDT: Spot Buy Area | %26 Profit if You Trade with MSB
📌 USUALUSDT: Buyers Are Active + %70 Profit in Total
🌟 FORTHUSDT: Sniper Entry +%26 Reaction
🐳 QKCUSDT: Sniper Entry +%57 Reaction
I stopped adding to the list because it's kinda tiring to add 5-10 charts in every move but you can check my profile and see that it goes on..
