LITECOIN UPDATE
Contrary to the previous setup, I have seen a scenario where the invalidation level could become a stop hunt, so what to do is simple; either cut position in half to reduce risk or hedge it with a spot or just close the entire position right now at a minimal loss. BINANCE:LTCUSDT
PREVIOUS ANALYSIS
OTHER ANALYSIS
LTCBULLUSDT trade ideas

Litecoin (LTC) Technical Analysis: A Comprehensive Look at the 4Litecoin (LTC) Technical Analysis: A Comprehensive Look at the 4-Hour Chart
Introduction
Litecoin has exhibited significant volatility, and the current technical setup suggests multiple trading scenarios. This analysis provides insights into the potential future movements of LTC against USDT, based on the latest data from Binance.
Technical Indicators and Patterns
EMA Lines (20, 50, 100, 200): The price of Litecoin is currently below the 200 EMA but above the shorter EMAs, indicating mixed signals. The 200 EMA acts as a resistance level, while the 50 and 100 EMAs provide some support below the current price.
Elliott Wave Pattern: The chart illustrates a complex Elliott Wave pattern which suggests that Litecoin may be in the latter stages of its correction phase. The completion of this pattern could lead to a new impulse wave.
Fibonacci Retracement Levels: The use of Fibonacci retracement levels from the recent high and low points shows significant resistance and support levels. Notably, the 0.618 retracement level near $91.93 may serve as a key resistance in the short term.
Volume Profile (Visible Range): The volume profile highlights substantial trading activity around the $84-$85 price range, indicating a potential pivot area where price might consolidate before making a more definitive move.
RSI and SQZMOM Indicators:
RSI (Relative Strength Index): The RSI is hovering around 58, suggesting that there is room for upward movement before the asset becomes technically overbought.
SQZMOM (Squeeze Momentum Indicator): This indicator shows that the momentum is currently neutral, with no immediate signs of a market squeeze.
Market Structure
The market structure shows Litecoin trading within a descending triangle pattern, suggesting a consolidation phase. A breakout or breakdown from this triangle could dictate the trend for the coming weeks.
Price Prediction and Trading Strategy
Short-Term: Traders should watch the $91.93 resistance level closely. A breakout above this level could lead to a test of the higher Fibonacci levels at around $103.36.
Medium-Term: If the price breaks below the support at $83.08, it could trigger a bearish trend towards the $77.85 support zone.
Conclusion
This analysis indicates that Litecoin is at a critical juncture. Traders should employ a strategy based on the breakout of the current price consolidation pattern, keeping an eye on key technical indicators and market reactions to these levels.
Disclaimer: This analysis is for informational purposes only and should not be considered financial advice. Always conduct your own research and consult with a professional before making any investment decisions.


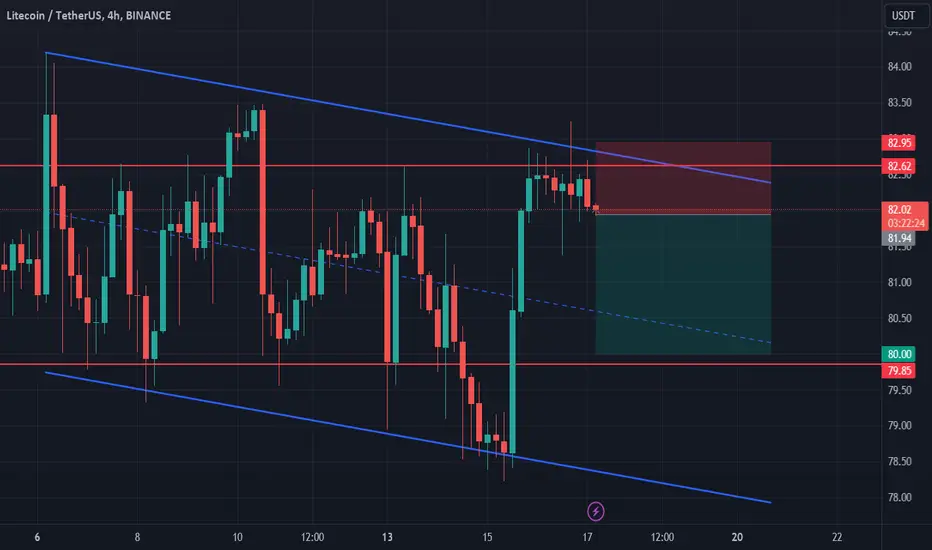
Litecoin (LTC): Broke EMAs (Good Moment For Sell)?Litecoin has finally broken EMAs on a 4-hour timeframe.
Now we are seeing a price move to that trend line where we might see some struggle, but we want it to be broken.
As soon as we break it and secure it, would be a good downward fall from there as well!!
If we somehow manage to hold it, then a movement back to upper resistance will be more reasonable!
Swallow Team

LTC is BullishAccording to the Technical analysis LTC already broken the consolidation and looking for long entry.
Once the Altcoins Rains stars it'll pump.
we can some LTC from here.

Litecoin shortLitecoin broke trough the ascending trendline. Asset broke trough the support level. Bearish movement to support level at 78.7 is possible.

LTC: big reward📊 Analysis by AhmadArz:
1. Support and Resistance Levels:**
- Support:** Around $82.80.
- Resistance:** Approximately $88.00 and $96.82.
- 📉🛑
2. Trend Channels:**
- Currently, the price is moving within a horizontal range and appears to be awaiting a breakout.
- 📈📊
3. Trading Strategy:**
- Buy Zone:** Enter buy positions if the price breaks and surpasses the $84.15 level.
- Target Price (TP):**
- TP-1:** $96.82
- 💹💰
-Stop loss: 82.80
⛔
4. Overall Trend:**
- The current trend is in consolidation. If the price can break the $88.00 resistance level, it is likely to move towards the higher target price.
- 🚀📈
In summary, consider entering buy trades if the price breaks the $88.00 resistance level and aim for the target price of $96.82.
🔗 "Uncover new opportunities in the world of cryptocurrencies with AhmadArz.
💡 Join us on TradingView and expand your investment knowledge with our five years of experience in financial markets."

Ltc trade idea updateLtc filled exactly as per previous trade idea and running in 7% profit. Now again I am watcing little bit down move then real move towards our main target.

Litecoin (LTC): Price Got Rejected !!!Litecoin has touched again that upper resistance zone and got rejected from there, where the price is now back trading below that resistance.
We are looking for a potential touch to EMAs here and a possible breakdown from it as well, overall, a downward movement from the current zone, so let's see!
Swallow Team

#LTC/USDT is testing the Diagonal Trendline in 1-Hour TF!#LTC/USDT is testing the Diagonal Trendline in 1-Hour TF!
CRYPTOCAP:LTC needs to bounce from here. Wait for a bounce to long it. In case of breakdown and retest, we can short it.

LTC IDEALtc has done C H o C H previous days and turned bullish now. That's why I am looking for long oppertunity and i have found it through one of my favorite setup OB+FVG+SSL. Chart says everything.


LTC generational bottomLTC is one of the OG coins which has been going sideways for almost 6.5 years. It has formed a double bottom and recently broke a trend line dating back from 2021. LTC is retesting the trend line and will most likely bounce back up. I'm buying more LTC.

Litecoin (LTC): Rejected From 200EMALitecoin is another one on our radar, for the same reason Polkadot was.
200EMA is being tested yet again, and we are seeing high chances of rejection happening from here!
If all plays well, we should see the movement in the next 48 hours, so we are waiting for further confirmation here!
Swallow Team

LITECON UPDATE - SHORT SETUP
now that daily bullish engulfing is what I have been expecting if this was going to be a wave 4-green Triangle. We now have a new invalidation level ($84.18) which presents us with a better risk reward ratio than before (3RR).
PREVIOUS ANALYSIS
OTHER ANALYSIS

Litecoin shortLitecoin bounced off the upper boundary of descending channel. Asset bounced off the resistance level. Bearish movement to support level 80 is expected to happen.
LTC/USDTThe Bearish Bat pattern is a specific type of harmonic pattern observed in financial markets, particularly in technical analysis trading. It is considered a variation of the Gartley pattern and is formed by a convergence of specific Fibonacci levels. This pattern is named "bat" due to its resemblance to a bat's wings.
Here are the key characteristics of the Bearish Bat pattern:
1. **Initial Move (X to A)**: The pattern starts with a significant price move, labeled as X to A. This move can be either upward or downward.
2. **First Retracement (A to B)**: After the initial move, there is a retracement, labeled as A to B. This retracement usually reaches the 0.382 or 0.50 Fibonacci retracement level of the XA leg.
3. **Second Move (B to C)**: Following the retracement, the price resumes its move in the direction of the initial move, labeled as B to C. This leg typically extends to the 0.886 Fibonacci retracement level of the XA leg.
4. **Final Retracement (C to D)**: After the completion of the BC leg, there is another retracement, labeled as C to D. This retracement typically reaches the 0.382 Fibonacci retracement level of the BC leg.
5. **Completion Point (D)**: The Bearish Bat pattern completes at point D, where the final retracement (C to D) terminates. Point D typically forms at the 0.886 Fibonacci retracement level of the XA leg.
Traders who recognize the Bearish Bat pattern may consider it a potential selling opportunity. They might look for additional confirmation signals, such as bearish candlestick patterns or bearish divergence in momentum indicators, before entering short positions. As with any trading strategy, risk management and proper position sizing are essential when trading harmonic patterns like the Bearish Bat.

LTC PriceThe Litecoin (LTC) triggered a breakdown and breached its critical 200 day EMA support zone in the last session.

LTC continues to lose bullish steamLTC continues to lose bullish steam
The price was brokeout by a complex pattern and currently confirmed a bearish wave.
It may be temporary, but it may also move further down to the second target.
We have seen several times that LTC suffers from the bullish volume problem.
On the other hand also BTC is not clear and it can push all the crypto market down
in this way.
You may find more details in the chart!
Thank you and Good Luck!
❤️PS: Please support with a like or comment if you find this analysis useful for your trading day❤️


LTC WEEKLY BULLISH CHARTLitecoin chart shows a break could lead to a 140% pump in the coming months, this is a risk you play with spot buying or low leverage.

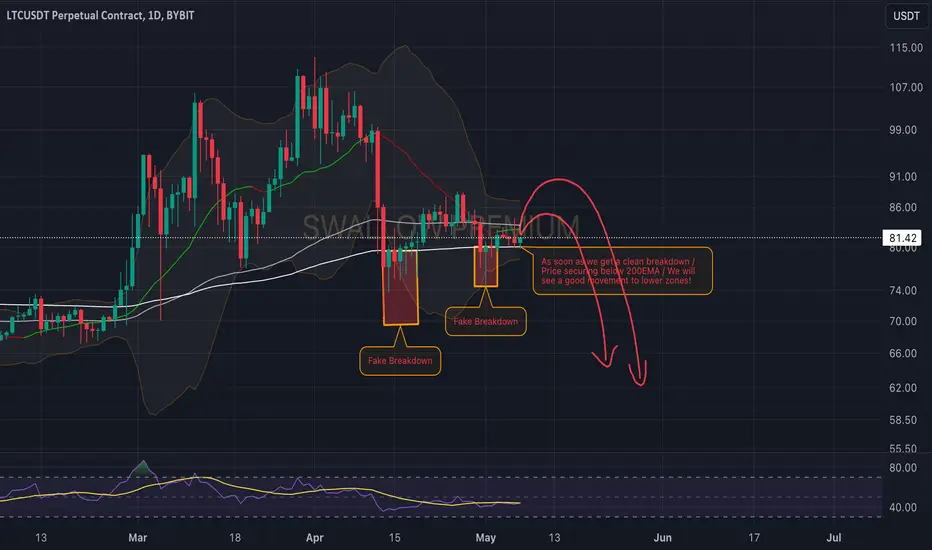
Litecoin (LTC): Keep an Eye on 200EMA!!!!Litecoin is back, and this time in the daily timeframe.
Here, our attention is all on that 200EMA, while multiple times it has been a zone of bounce for the coin.
Pressure is high and demand is high in that zone, so we are looking for any potential candles to secure this zone fully in order to see a full-scale movement to lower zones here!
Swallow Team
LTC (LITECOIN) UPDATE - SHORT TERM TRADE SETUP
This is BINANCE:LTCUSDT update following through on our daily timeframe analysis. It looks as though we are about to end an impulse (context on daily timeframe chart - see below).
Wave 1, 2, 3-green is done. Wave 4 has begun, already created it first wave A, B & C where wave C retraces and has been rejection at the 60% Fibonacci level of wave A which looks like a perfect order block or some other fancy names other analyst call it :).
Now we wait for wave D & E to complete. Meanwhile we could see a push out of the channel close to previous swing high (wave A-blue) at $88 to which would still end up being a Triangle but that scenario is very less likely. Either way the invalidation (red dotted line) is clearly on the chart ($92.97)
More confluence, classically, is the DESCENDING PARALLEL CHANNEL where price has rejected few times (circles) from here on I expect price to start dumping to create some kind of short term temporary support which becomes a sell side liquidity to be taken later. I mean come to think of it, it's weekend so that little usual dump is expected too.
PREVIOUS ANALYSIS
OTHER ANALYSIS
