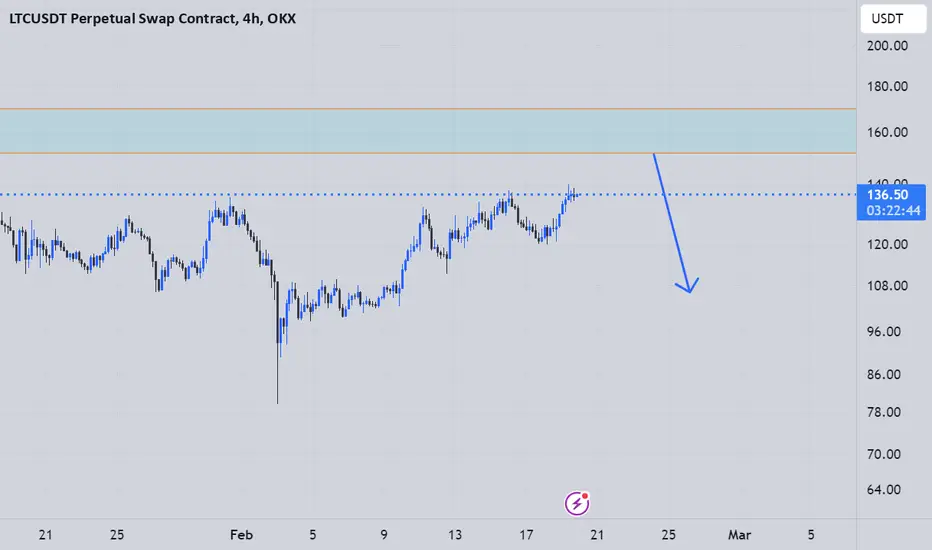
LTC Short, depends on BTC and BRC D.it looks like a short, but a little bit risky.
watch BTC and BTCD. too
LTCUSDT.P trade ideas

LTC has completed the accumulation phase! LTC completes its accumulation phase of more than 896 days and is preparing for a breakout! I would expect a hike to the 0.786 Fibonacci level, as this is a project with huge capitalization, but with poor usability. With spillovers from Bitcoin, Ethereum and Solana it could show huge growth!
Horban Brothers.

LTC short positionits a smal short position before a good pump
you can use candlestick patterns in lower timeframe for entry
ltc critical updateltc forming a inverted h&d and this is the only coin to stay profitable when everything is going down, now is the time to buy imo 200-500 per ltc

LITECOIN 4H (LTC)Litecoin is one of the best performing majors in recent weeks and finds itself around the mini range highs in an area of key resistance. The way I'm looking at this chart is in two separate sections of the same mini range, a lower range and upper range with an area of indecision between that separates the two.
Despite how choppy the market has been price can be clearly analyzed in this format:
Lower range - Clear level of support where buyers are stepping into the market aggressively to rebound any sell off and pushing price up further towards the 1D 200 EMA. There is one instance of price sweeping below range low and quickly reclaiming back above, that move has been a catalyst for bullish PA ever since with a strong bullish structure.
Upper range - The top of the upper range has yet to be retested as there is major resistance area position just before it, this bearish orderblock has rejected 4 times and is now being tested for a 5th at time of writing. It is important to note that the 1D 200 EMA is currently at its highest point during this rangebound environment, coupled with higher highs and higher lows on the low time frames, Litecoin is looking good currently.
However, bitcoin is still very much the dominant force in the market, and without bitcoin paving the way I can't see LTC making a breakout move just yet. In order for Litecoin to make a run for the highs I would like to see BTC @ $98,000 with a full reclaim of the weekly midpoint (See weekly outlook).
To conclude, Litcoin is in better shape than most other coins but this rangebound environment should be treated as such until proven otherwise, no action needs to be taken in the main bulk of either the upper or lower range, just the tops and bottoms are worth acting on IMO.

Litecoin Surpasses $130 – Is a Move Toward $200 in Play?Despite broader market uncertainty and declines across major altcoins, Litecoin (LTC) has held its ground above the key $125 support level, signaling strong bullish momentum.
The asset has gained 10.72% in the past 24 hours and 15.95% over the last week, while its monthly increase stands at 12.23%. With a Year-to-Date (YTD) return of +32.56%, LTC continues to demonstrate resilience.
Technical Outlook
SMA Support – The Simple Moving Average (SMA) reinforces the bullish trend in the daily timeframe.
RSI Strength – The Relative Strength Index (RSI) has rebounded from neutral levels and is approaching the overbought range.
Trendline Support – The average trendline continues to hold, suggesting further upside potential.
Price Targets
Bullish Scenario: If momentum holds, LTC could challenge $147.25, and a break above this level may open the path toward $180.
Bearish Scenario: If sellers gain control, Litecoin may retest $115.50, with extended downside risk to $100 if selling pressure intensifies.
With current technical support intact, Litecoin appears well-positioned for continued gains. However, the market's broader trajectory will be a determining factor in whether LTC can push toward $200 in 2024.

BUY SPOT LTCUSDT (W-M Swing Trade for 2025)🚀 BUY SPOT LTCUSDT (W-M Swing Trade for 2025)
📢 LTCUSDT is in a weekly correction phase, presenting a strong accumulation opportunity for mid to long-term gains.
📌 Market Outlook & Trade Plan
✔ Most coins, including LTC, are undergoing a weekly timeframe correction.
✔ The ideal buy zone was $98 - $112, but current prices ($120) are still reasonable for long-term positioning.
✔ LTC has strong breakout potential, targeting $300+ in the next major uptrend.
📌 Trade Strategy:
Trend: Buy Spot (Swing trade based on W or M cycle, depending on capital allocation).
Entry Point: $120+ is still a reasonable zone despite the ideal buy range being lower.
Target Levels:
$160 (First target)
$215 (Mid-term breakout target)
$300+ (Long-term potential)
Hold Time:
4-5 weeks if trading the W cycle.
Throughout 2025 if following M & 3M cycles.
💡 Key Considerations:
✔ Adjust capital allocation based on whether you are trading W, M, or 3M cycles.
✔ Monitor market trends and breakout confirmations for stronger momentum.
✔ Consider taking partial profits at key resistance levels for risk management.
🔥 LTCUSDT remains a strong long-term play – Accumulate and position wisely! 🚀

LtcusdtLooking bullish 140 to 145 strong resistance
If it’s break go further parabolic
If it’s reject go back its initial support

Ltc scalp short to $118Recently opened a ltc scalp short. Am targeting $118. Roughly 2.4RR
Even though etf news is looming in terms of approval and people seems quite bullish on it judging by the PA in comparison to other coins...It won't just go up in straight line.
It failed to hold prior daily support and now I think the bears will take over a little bit.
At $118 we'll likely get some demand.

LTC short short ltc at 154 as there is a monthly BB, and stop loss is just above the BB at 174 $ if the price closes abvove it then wait for a pull back into that area to look for long opportunities

LTC h chart analysis breakout guys LTC has almost finish his correction can lead to back previous top
targets are clear in chart long term target are much mush higher
enjoy the trade support my idea like and comment to reach more community
cheers

LTC about to Jump the CreekShown here is LTC on the 12 hour time frame. It is in a symmetrical triangle pattern, which typiclaly is an indecisive pattern. However, the recent dip and strong bounce up is indicative of the Wycoff Spring Setup. Instead of a Range Break Fake-Out to the downside, the Wyckoff Spring is a more like a Range Break Fake-Out to the Upisde.
The very high volume that took place on 4 February 2025, means that a 2nd minor dip is likely to occur, and I predict that the little dip taking place today on 18 Feb 0700 UTC, is that 2nd dip, or retest.
I expect some sideways movement for the next half day to day and then a major breakout to the upside after the price action decivivley breaks through the resistance level of the symmetrical triangle. This decive break above resitance is often referred to as "Jump the Creek".


LTCUSDT buy opportunityLTC/USDT has been forming a macro reversal structure, completing a well-defined W-pattern, signaling a shift in momentum. Price successfully broke through the long-standing trendline resistance, followed by a strong retest and a bullish continuation, confirming market strength.
The immediate buy-back zone serves as a key accumulation area, aligning with structural confluence and previous demand zones, ensuring a solid base for continuation with secondary buy back been provided if the earlier zone fail to hold.
The breakout from the corrective structure wave abc reinforces the bullish outlook, with price exhibiting impulsive characteristics that align with an Wave structure, suggesting a sustained move toward higher levels.
Liquidity absorption within key supply zones has fueled a breakout, targeting the $652.08 level. The mid-term supply area remains a key reaction point, where temporary pullbacks may occur.
However, sustained momentum above this zone supports further price discovery. The combination of liquidity flow, structural confirmation, and the overall bullish trend increases the likelihood of an extended rally following the projected path.

LTC BUY Trade BTC | TRUMP | XRPBuy area around 115 if BTC dont dump more
stoploss below 109
no leverage trade

LTCUSDT 12 Hour Higher Low. Great risk:reward setupLTC is still holding it's bullish structure, forming a possible 12 hour higher low compared to the last 12 hour low at $124.3 (thick white line). Price also recently took out the previous hourly lows (thin white line) as outlined by the circle. I'm waiting for price to pullback as shown toward $125 - 126 and hopefully starts to bounce from there for some continuation. Very low risk trade as my stop will go under $124.5, and if the 12 hour higher low forms, you can get plenty of upside. LTCBTC also had its first bullish cross between the 12 and 26 eta's in almost 2.5 years. Could be a precursor signal for LTC to bounce strong in the upcoming weeks.

LTC Choch 2.16.25bullish retest complete at the 1.618 trend line. Bull divs up to 6m. orange ball at 15m incoming.

LTCBeraish divergence going on on the RSI
therefore we can plot 2 high probbale scenarios, a huge dunmp or conitinue correction phase
thats all I can take from LTC,nothing much going on here
SL please
good luck

LTC Aims for $140 After Mid S/R BreakoutPrice is trading within a broad range between the $98 support and $140 resistance. After breaking out of the mid S/R line around $115, the price could now move toward the $140 target.
A breakout above $140 may trigger a strong bullish rally, while a drop below $98 signals bearish risks. Watch for volume confirmation!

Litecoin Easy Above $200, $300 & $400 Mid-2025 —The New BullLast week Litecoin produced a very strong bullish signal in the form of a hammer candlestick pattern.
This signal is quite revealing. The long lower wick of the candle reached below the 16-Dec. 2024 low and yet closed much higher. This close happened above the 1-April 2024 session open and close. Revealing that a market flush was successfully completed.
The action this week is even more revealing and works as confirmation. A very strong bullish candle, full green, trading higher on the session body than all previous weeks since the last peak in early December.
The most revealing signal as well as supportive of a new bullish wave developing now, is the high volume. This week is producing the highest volume ever on this exchange.
Currently, LTCUSDT sits at $131. I can see easily prices above $200, $300 and even $400 but this wouldn't be equal to the All-Time High. The end price for this bullish cycle can end much higher. Try searching for LTCUSDT in my profile for additional information on this part, or wait for a new publication where the focus will be the 2025 All-Time High.
A session close this week above $121, tomorrow, confirms a very strong reversal of the recent correction dynamics as well as the resumption of the bullish trend. The latest bullish trend started with the low in early August 2025.
It seems Litecoin will be one of the known projects to move early and with force in this cycle. Maybe a good option to add to a highly diversified portfolio. This pair can also hold big capital and has stability. It has been proven trustworthy based on its longevity. A point that can be relevant to whale holders, investors and traders.
The low is in. The correction is over.
Right now it is the time for sustained growth.
The anticipation is amazing. We are ready. We are ready. How good can it get?
How high can the market really grow?
Are we seeing the start of a break of a major pattern? The four years cycle.
Will Crypto enter its first ever 10 years long bull-market? It is too early to say.
I can say for sure that 2025 will bring us tons of growth, tons of innovation, lots of improvements, a change in the fundamentals and regulations that rule the market. Cryptocurrency is now legal. Cryptocurrency is here to stay.
Thanks a lot for your continued support.
Remember, you will always deserve the best.
Namaste.

Litecoin: Another Bullish Wave, Or Same?Can we say this is a new bullish wave, or is it the same? It is definitely the same bullish wave that started in late November with a bottom in August 2024.
This bullish wave saw a 40% correction in 2 weeks time which activated the 0.618 Fib. retracement level. This level was activated perfectly and signals that the correction low, most likely than not, is in. This part can be tricky. Let me explain what I mean.
Litecoin closed three days green and today is the fourth day this pair trades green. Here it can happen that we see a small advanced followed be another drop, a sudden drop, that produces a higher low. It can also happen that the market moves straight up. With very low volume, the bullish resumption is still not confirmed. This is the part that is tricky. It is hard to say if LTC will hit a higher high next or go through a higher low first.
There is nothing tricky here when you focus on the long-term. Short-term, anything goes. In fact, rather than a higher low or straight up, LTCUSDT can go sideways for a few days and then grow. All scenarios are possible, available and open.
The truth is that everything is quite simple, this chart is easy; Litecoin is going up.
The next rise can happen within 3 days, 10 days or 33.3 days; doesn't change anything, we are happy as long as the market grows. And it will grow.
On the chart we have short- to mid-term targets. We expect much higher prices by the completion of the current bullish phase.
We are only getting started. Are we?
You can bet so.
Thank you for reading.
Namaste.

$LTC Looking goodLitecoin has broken its downward trendline, but the key static resistance ahead remains crucial. If it manages to break through, it could see a strong rally.
It's better to wait for confirmation. Keeping it on the watchlist seems like a good idea!

#LTCUSDT ( a line )A line chart and a strong and major resistance at the red arrow,
which can be sweet and hearty if it is broken,
so we are closely monitoring the breakdown of this resistance.
