Lunc scenario to 0.000648As we can see on daily tf, it’s printed a pretty nice double bottom + timing of corrections was also perfect, we can expect new ATH soon.. #NFA
LUNCUSDT.PS trade ideas

Separation of Pattern (LUNC)LUNC is currently printing a rising wedge and also the RSI is printing HL.
Wait for confirmation on the yellow line and also check the RSI before going long. TP at the top of the arrow path.
Not a financial advice but also a trade I would be taking. Good luck

LUNCUSDT - Horizontal BottomI expect price to keep moving down towards this horizontal point of support which has seen two prior bounces off it on this daily chart.
If a move like this happens it will flip price back bullish.
If there is no bounce bears are still in control and price will probably slip further down.

$LUNC 's fate#lunaclassic #lunc price is now holding the vertical support zone. Unclaiming this zone will bring #terraluna price to bottom of the channel.

LUNC to 0.00018Seems like LUNA coins are building something. All luna based coins have good news recently, burns, more pairs, terra case resolved in court, have to throw away keys to wallets.

LUNC is bearishThe general structure of LUNC is bear.
The latter has swept orders by hitting a supply and then broke the support line.
A resistance swap range has also been formed on the chart, in which we are looking for sell/short positions.
The targets are clear on the chart.
Closing a daily candle above the invalidation level will violate the analysis
Note that the financial market is risky, so:
Do not enter any position without confirmation and trigger.
Do not enter a position without setting a stop.
Do not enter a position without capital management.
When we reach the first TP, save some profit and try to move the stop continuously in the direction of your profit.
If you have any comments please post them, comments will help us improve our performance
Thanks

Despite Binance Burn 1.35 Bln LUNC Chart shows a Bearish PatternBinance has burned 1.35 billion SEED_DONKEYDAN_MARKET_CAP:LUNC tokens in its 22nd batch of its SEED_DONKEYDAN_MARKET_CAP:LUNC burn mechanism, marking a bearish pattern in the crypto exchange's net burn. The total SEED_DONKEYDAN_MARKET_CAP:LUNC burn by Binance has now surpassed 60 billion, accounting for more than 52% of the total SEED_DONKEYDAN_MARKET_CAP:LUNC burned by the Terra Luna Classic community. The 22nd batch of the SEED_DONKEYDAN_MARKET_CAP:LUNC burn mechanism burned a significant amount of trading fees for the period between April 30 and May 29. Binance has now burned nearly 60.42 billion SEED_DONKEYDAN_MARKET_CAP:LUNC tokens from trading fees on SEED_DONKEYDAN_MARKET_CAP:LUNC spot and margin trading pairs.
Last month, Binance burned 1.4 billion SEED_DONKEYDAN_MARKET_CAP:LUNC tokens. The exchange burned 1.40 billion in trading fees on LUNC spot and margin trading pairs worth $156,362 as trading volumes fell significantly in April. However, trading volumes reversed higher in the last few weeks of May, with prices mostly trading sideways near $0.00012.
SEED_DONKEYDAN_MARKET_CAP:LUNC and OTC:USTC prices continue to trade under pressure even after the Binance SEED_DONKEYDAN_MARKET_CAP:LUNC burn due to a recent crypto market selloff, causing Terra Luna Classic ecosystem tokens to pare recent gains. The community narrative has switched to development activity and SEED_DONKEYDAN_MARKET_CAP:LUNC burns in May, bringing back speculation of SEED_DONKEYDAN_MARKET_CAP:LUNC price hitting $0.0002. SEED_DONKEYDAN_MARKET_CAP:LUNC price has rallied over 17% in a month amid buying from spot and derivatives traders, currently trading at $0.000117.
Despite the burning streak by Binance, the token seems to trade in respite to the burn campaign. The memecoin is down by 2.76% technically, SEED_DONKEYDAN_MARKET_CAP:LUNC 's daily price chart depicts a bearish symmetrical triangle pattern in the long term. But the Relative Strength Index (RSI) which is at 56.59 gives hope of a trend reversal for long and short term investors alike.

Terra Classic (LUNC) 4H TF AnalysisOn the 4H TF LUNC is currently exhibiting important technical patterns. The volume profile shows the highest trading activity around $0.0001077 to $0.0001047, indicating strong support levels. Recently, the price action has been sideways, suggesting a balance between buying and selling pressures, with low trend strength and volatility, indicating consolidation.
Key resistance levels are at $0.0001253, $0.0001324, and $0.0001425. Key support levels are at $0.00011, $0.0001015, and $0.00009220. The price is just above a crucial support level at $0.00011; a break below this could lead to a retest of lower support levels.
Two patterns are visible: a falling wedge and a bearish pennant. The falling wedge, a bullish pattern, has completed, with the price breaking the upper boundary and entering consolidation, suggesting a potential breakout to $0.00017.
Conversely, the bearish pennant indicates potential declines. If the price breaks the pennant's lower boundary, it could test the lower boundaries of the sideways trend. If support fails, the price may fall to $0.00009220 - $0.00008662.
Summary:
◼️ Strengths: Strong support around $0.00009220 and a completed falling wedge pattern suggesting a potential end of the downtrend.
◼️ Weaknesses: The bearish pennant suggests further downside risk, with a crucial support level at $0.00011; a break below could lead to significant drops.
History and Background of Terra Classic (LUNC).
Terra Classic (LUNC) is the rebranded version of the original Terra (LUNA) token, which experienced a dramatic collapse in value in May 2022. Here's an overview of what happened and the current state of Terra Classic, highlighting its strengths and weaknesses:
Background of Terra (LUNA) Collapse:
Collapse Details: Terra (LUNA) and its associated stablecoin TerraUSD (UST) were part of the Terra blockchain ecosystem. UST was designed to maintain a 1:1 peg with the US dollar through an algorithmic mechanism involving LUNA. In May 2022, UST lost its peg, leading to a massive sell-off of both UST and LUNA, causing LUNA's value to plummet from over $80 to less than a cent within days.
◻️ Impact: The collapse wiped out billions of dollars in market value, significantly impacting investors and the broader cryptocurrency market.
Transition to Terra Classic (LUNC):
Rebranding: Following the collapse, the Terra community and its founder, Do Kwon, proposed a recovery plan. This plan involved rebranding the original chain as Terra Classic, with its native token renamed to Terra Classic (LUNC).
◻️ New Chain: A new Terra chain was launched without the algorithmic stablecoin, maintaining the name Terra (LUNA) but as a distinct entity separate from Terra Classic.
Current State of Terra Classic (LUNC):
Community and Governance: Terra Classic is now community-driven, with governance decisions being made through proposals and voting by LUNC holders.
◻️ Development: The community is working on various initiatives to revive and develop the Terra Classic ecosystem, including potential integrations, dApps, and improvements to the blockchain's infrastructure.
◻️ Market Performance: LUNC has seen fluctuating interest and trading volumes. Its value remains highly volatile, influenced by broader market trends and specific developments within the Terra Classic community.
Key Points for Investors and Traders.
➖ Strengths:
◼️ Active Community Involvement: The dedicated community is actively involved in governance and development, which could drive future growth.
◼️ Ongoing Development Efforts: Continuous work on ecosystem development, including dApps and infrastructure improvements, adds potential value.
➖ Weaknesses:
◼️ High Volatility: LUNC's value remains highly volatile, making it a speculative and high-risk investment.
◼️ Historical Context: The collapse of the original LUNA casts a long shadow, contributing to skepticism and caution among investors.
Market Sentiment: The sentiment around LUNC is heavily impacted by news, updates from the Terra Classic community, and overall market conditions.
Conclusion:
Terra Classic (LUNC) represents an attempt to salvage and rebrand the remnants of the original Terra (LUNA) project after its catastrophic failure. While it has a dedicated community striving to rebuild, it remains a speculative and volatile asset. Investors and traders should approach LUNC with caution, keeping in mind its historical context and the inherent risks associated with it.
Always remember the golden rule of investing: never risk more than you can afford to lose. Trade carefully and wisely, and may each of your transactions be successful!

#LUNC/USDT
#LUNC
We have a bearish channel pattern on a 12-hour frame, the price moves within it, adheres to its limits well, and is expected to break it upwards strongly.
We have a support area at the lower border of the channel at $0.0000800 from which the price rebounded
We have a tendency to stabilize above moving average 100
We have a downtrend on the RSI indicator that is about to break higher, supporting the price higher
Entry price is 0.0001000
The first goal is 0.0001280
The second goal is 0.0001530
The third goal is 0.0001800

LUNC ANALYSIS (6H)LUNC appears to be forming a large triangle or diametric pattern.
It looks like wave D is over and we are now entering wave E.
Wave E appears to be a diametric.
After the completion of wave e and f from E, we are expected to move towards the targets for wave g from E.
The green range is where we look for buy/long positions.
Closing a daily candle below the invalidation level will violate the analysis.
For risk management, please don't forget stop loss and capital management
When we reach the first target, save some profit and then change the stop to entry
Comment if you have any questions
Thank You

LUNC/USDT is in accumulation zoneRight now is a good area for accumulating a LUNC position. I'm bullish.

"LUNC" Strategies Using Strong Selling PowerHello friends, nice to meet you. I hope you have a good day
#LUNC
It had hoped for a rebound after the big fall, but it continues to be resisted by the power of sell.
Currently, It was retested about fall in the zone, and It is dropping down.


SHORT TERM PUMP?avp + avwap + frvp + pivot are all supporting bullish bias.
short term pump incoming??
++++++++++++++
avp + avwap + frvp + pivot are all supporting bullish bias.
short term pump incoming??avp + avwap + frvp + pivot are all supporting bullish bias.
short term pump incoming??avp + avwap + frvp + pivot are all supporting bullish bias.
short term pump incoming??avp + avwap + frvp + pivot are all supporting bullish bias.
short term pump incoming??avp + avwap + frvp + pivot are all supporting bullish bias.
short term pump incoming??avp + avwap + frvp + pivot are all supporting bullish bias.
short term pump incoming??avp + avwap + frvp + pivot are all supporting bullish bias.
short term pump incoming??avp + avwap + frvp + pivot are all supporting bullish bias.
short term pump incoming??avp + avwap + frvp + pivot are all supporting bullish bias.
short term pump incoming??avp + avwap + frvp + pivot are all supporting bullish bias.
short term pump incoming??avp + avwap + frvp + pivot are all supporting bullish bias.
short term pump incoming??avp + avwap + frvp + pivot are all supporting bullish bias.
short term pump incoming??avp + avwap + frvp + pivot are all supporting bullish bias.
short term pump incoming??avp + avwap + frvp + pivot are all supporting bullish bias.
short term pump incoming??avp + avwap + frvp + pivot are all supporting bullish bias.
short term pump incoming??

LUNC spot buy/sell zonesLast LUNC from november 2023 left much liquidity to grab.
Most possible, but least trustable zoone is first at the chart marked with green demand box or red supply zones.
Gold boxes are high quality zoones, for short or long either.
BUY
My favourite scenario is the one with hitting new low but as the realist i would buy in green and first gold box
SELL
One place that i can see to stop the price can be red box but it isnt too dangerous place. I will hold my bought LUNC untill i will see readable distribution scheme.

Time to buy big goals LUNCUSDTYou have achieved your color or price target
Now is the time to buy the second goal. Are you ready!!


Luncusdt trading opportunityLuncusdt is currently trading within a downtrend channel, with the price expected to test the immediate supply area of 0.0001596. If the price fails to break this level, it's expected to continue dropping towards the Landing Zone, which can be used for potential long accumulation.
It's important to note that a breakout from the downtrend channel could signal a potential trend reversal. We should keep an eye on the immediate supply area and wait for a clear breakout before considering a long position. The overall target for the downtrend channel is the midterm price target zone as shown on the chart.
It is a must to watch the price action carefully and consider the risk-reward ratio before making any trading decisions.

LUNCUSDT By HesamUNTHey traders
what u think about LUNC ?
im looking for one more dump to the Daily Demand area, and then ill buy some there
check the chart and lvls for potential targets
share ur thought and leave a comment


LUNC Symmetrical Triangle PatternLUNC is in very interesting position right now.
We have break Weekly 22,55 MA they act as support zones now.
We have tested twice the upper yellow arm of Symmetrical Triangle
We have tested three times the lower yellow arm of Symmetrical Triangle
Action may occur at Late April or May.
If we break upper arm of Symmetrical Triangle i would see for move at least to 0.00037 with potential move to 0.0005
If we break lower arm of Symmetrical Triangle we will dump to 0.000054 again.
Here is good position for long term long x5,x10 or SPOT with stop lose below 0.000115
Be patient MOON Boys :=D

LUNC is trying to breakout...Possible bullish moment here.. if LUNC makes breakout we will see a huge raise of 500% at least, if not more.
THIS IS NOT A FINANCIAL ADVICE, PLEASE INVEST AT YOUR OWN RISK

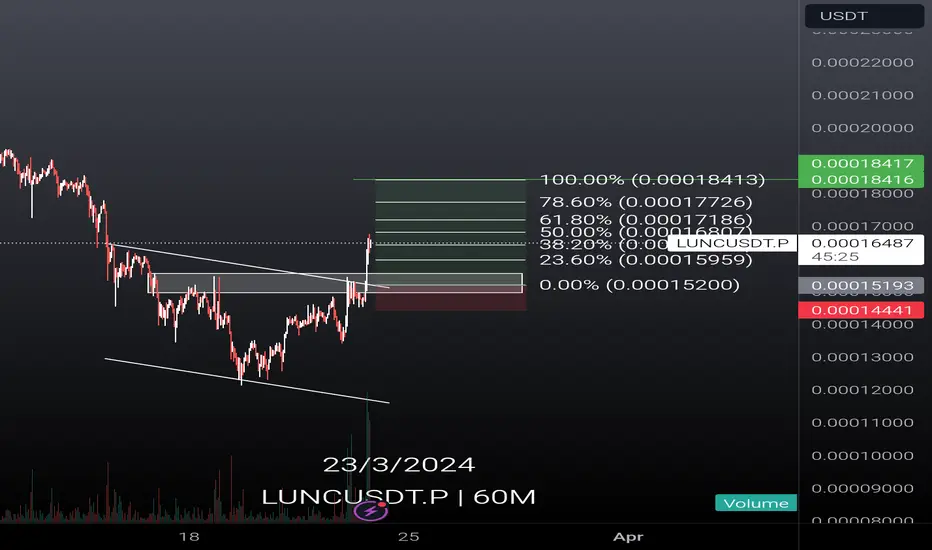
LUNCUSDT.PHello Trader BITGET:LUNCUSDT.P
falling wedge pattern valid bullish, but haven't made a retest for this, can take the area at 0.00015200
take profit 22%
stop loss 5%
Please add a comment and Positive feedback and constructive criticism are important to authors and the community.
Disclamer: Not Financial Advice