Decentraland: Your Altcoins Choice (S5)I looked at MANA (Decentraland) recently, two weeks back, and the chart is the same but with the bullish reversal now confirmed.
MANAUSDT produced a major low last month and now is full green. This is the fourth week with growing prices and a bullish bias. A clear recovery. This recovery will lead

MANAUSDT 1D AnalysisMANA ~ 1D Analysis
#MANA Buy gradually when re -testing this support with a short -term target of at least 15%+ from here.
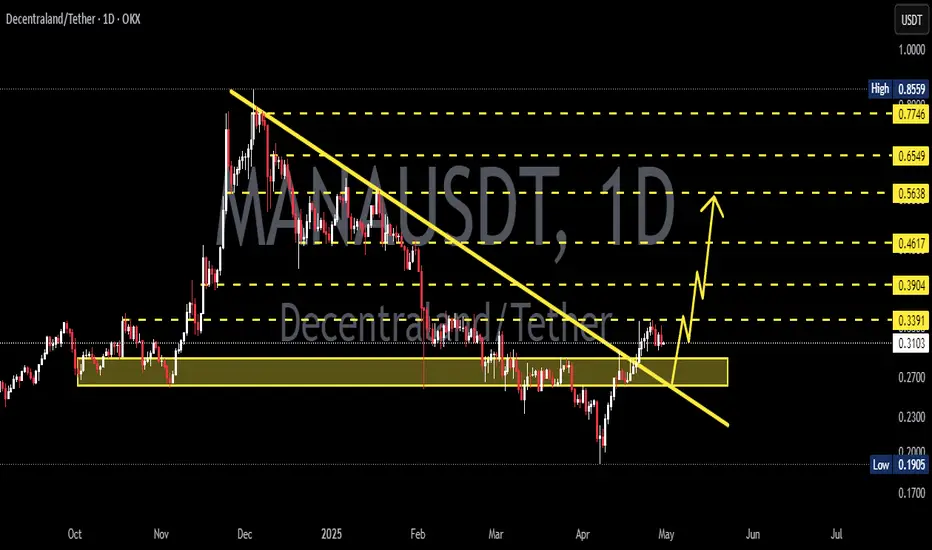
MANA Weekly AnalysisMANA Weekly Analysis
MANA is showing a positive divergence on the weekly timeframe.
This coin has the potential to rise toward the marked resistance levels.
It’s recommended to take profit at the first resistance level.
For added caution, you can rely on the lowest support zone as a safer stop level

MANAUSDT Huge Bounce Incoming?MANA is currently testing a long-term descending support trendline on the weekly chart. This level has acted as a reliable bounce zone multiple times in the past (highlighted with arrows).
-Price is holding above a major support level (~$0.21), showing signs of demand.
-Weekly RSI is forming a bul

MANA at a Crucial Support | Bullish Reversal in Play?Hey traders!
#MANA is currently testing a strong historical support zone and has shown signs of a bullish bounce, holding above key levels. This could be the beginning of a trend reversal if momentum continues.
Technical Highlights:
Strong support holding firm
Bullish wick rejections near suppor

Conspicuous - MANA / USDTEvening fellow traders,
Every now and then I ride waves on MANA.
This time it won't be different, as I am already in it.
But I'm looking for an extra touch, that outta the box type thing and buying an extra chunk between the prices shown in the chart.
Please take advantage of this if you get th

TradeCityPro | MANAUSDT Fake Breakout Trigger Activated!👋 Welcome to TradeCityPro Channel!
Let’s dive into the analysis of one of the metaverse coins and quickly check the trigger and the action unfolding on its chart together!
🌐 Overview Bitcoin
Before starting the analysis, I want to remind you again that we moved the Bitcoin analysis section from

Decentraland to Skyrocket 6000% in 2025? Explosive Potential...On the above 4-day chart price action has corrected 96% since November 2021.
A recession is coming, everyone is talking about it… that can only mean one thing, sellers are ready drop the price action the remaining 4% to $0
But what if…. What if price action prints a 6000% upward move instead?
B

MANA Motive Wave
The gray descending trendline has been broken, in what looks to be a motive wave (green I-V).
I will be looking for green IV corrections, ideally retesting the trendline, for long trades.
On the flipside, there is no RSI divergence on the recent low, so the probability that we have seen a bottom

Decentraland: Success In 2025 & BeyondRemember the linear chart. When the action goes flat and the candles become very small, sometimes almost invisible, it means that the current sideways period is reaching its end.
After a bear market there is a long-term consolidation phase and then the next bull market. The long-term consolidation

See all ideas
Summarizing what the indicators are suggesting.
Oscillators
Neutral
SellBuy
Strong sellStrong buy
Strong sellSellNeutralBuyStrong buy
Oscillators
Neutral
SellBuy
Strong sellStrong buy
Strong sellSellNeutralBuyStrong buy
Summary
Neutral
SellBuy
Strong sellStrong buy
Strong sellSellNeutralBuyStrong buy
Summary
Neutral
SellBuy
Strong sellStrong buy
Strong sellSellNeutralBuyStrong buy
Summary
Neutral
SellBuy
Strong sellStrong buy
Strong sellSellNeutralBuyStrong buy
Moving Averages
Neutral
SellBuy
Strong sellStrong buy
Strong sellSellNeutralBuyStrong buy
Moving Averages
Neutral
SellBuy
Strong sellStrong buy
Strong sellSellNeutralBuyStrong buy
Displays a symbol's price movements over previous years to identify recurring trends.