Dollar Doomsayers Are Dead Wrong: Why USD Will Crush It in 2025.Road To a Million fam! It’s your boy, back from the wilderness after a hiatus that felt longer than a bear market in a crypto crash. I’m pumped to be here, ready to drop some truth bombs, dissect the markets, and—most importantly—help us all make some serious bank. Buckle up, because there’s a ton to unpack, and we’re diving headfirst into the biggest elephant in the room: the U.S. dollar (USD). Spoiler alert: it’s not dead, it’s not even close to dead, and anyone saying otherwise is probably shorting it while crying into their latte. Let’s get into it!
The Dollar Drama: What’s the Deal?
If you’ve been anywhere near a financial newsfeed in 2025, you’ve heard the doomsday choir singing, “The dollar is done! Kaput! Finito!” The Dollar Index (DXY) is down 8% this year, and the Twitter (sorry, X) finance bros are out here proclaiming the end of the greenback’s reign as the world’s reserve currency. They’re screaming about de-dollarization, BRICS taking over, and gold mooning like it’s 1971. Meanwhile, I’m over here sipping my coffee, looking at the charts, and laughing. Why? Because the dollar’s obituary is the most exaggerated piece of fan fiction since Twilight.
Let’s cut through the noise and get to the meat. The USD has taken a beating, sure, but an 8% drop in a year doesn’t mean it’s packing its bags and moving to the Bahamas. The dollar is still the king of global trade, the backbone of international commerce, and the currency you need if you’re, say, India buying oil from Saudi Arabia. No one’s trading rupees for barrels, folks. They’re selling rupees, buying dollars, and getting that black gold. That’s the reality, and it’s not changing anytime soon.
So, why the panic? Why is everyone acting like the dollar’s about to be replaced by Dogecoin or a shiny new BRICS coin? Let’s break it down, roast the naysayers, and then talk about how we’re gonna make money off this drama. Because, let’s be real, that’s why you’re here.
Why the Dollar’s Down (But Not Out)
First, let’s address why the DXY is down 8% in 2025. The Dollar Index, for those new to the game, measures the USD against a basket of major currencies—56% euros, plus some GBP, JPY, CHF, CAD, AUD, and a sprinkle of others. It’s like a currency Thunderdome: one dollar enters, a bunch of others try to take it down. When the DXY drops, it means the USD is weakening relative to these currencies. But why?
Interest Rate Shenanigans: Central banks are the puppet masters of forex markets, and their interest rate moves are like plot twists in a soap opera. The U.S. Federal Reserve cut rates by 25 basis points to 4.25–4.5% on December 18, 2024, signaling a slightly dovish stance. Meanwhile, the Eurozone slashed its rate to 2.25% on April 17, 2025. That’s a 2% differential in favor of the U.S., which is huge in forex land. But the market’s been spooked by the Fed’s cut, thinking it’s the start of a softening cycle, while other central banks (like the ECB) are also cutting, creating a weird global rate limbo.
Inflation Tug-of-War: Inflation in the U.S. is at 2.4%, while the Eurozone’s at 2.2%. That means U.S. investors are getting a real return of about 2% (4.25% interest minus 2.4% inflation), while Eurozone investors are basically breaking even (2.25% minus 2.2% inflation). Money flows where it’s treated best, and right now, the U.S. is the VIP lounge. But short-term traders are freaking out over inflation fears and potential rate cuts, which has pressured the USD.
Trump’s Tariff Tantrums: Oh, Donald. The man’s back in the White House, tweeting (X-ing?) up a storm about “Making America Great Again” with tariffs left, right, and center. His trade war threats—10–20% tariffs on imports, 60% on Chinese goods—have markets jittery. A stronger dollar could make U.S. exports pricier, so some traders are betting on a weaker USD to balance things out. Spoiler: I think they’re wrong, and I’ll explain why later.
De-Dollarization Hype: The BRICS bloc (Brazil, Russia, India, China, South Africa, and friends) has been pushing for a non-USD trade system, with talks of a new currency or gold-backed system. This has fueled the “dollar is doomed” narrative. But let’s be real: a BRICS coin? Good luck getting China and India to agree on anything, let alone a unified currency. And gold? It’s ripping higher (more on that later), but it’s not replacing the USD for global trade anytime soon.
So, yeah, the dollar’s been punched in the face a few times this year. But it’s like Rocky Balboa—it’s taken worse beatings and still comes out swinging. The question is: Is this the end of the dollar’s dominance, or is it just warming up for a comeback? Let’s look at the big picture.
The Dollar Ain’t Going Anywhere (Here’s Why)
Listen up, because this is where I get on my soapbox and preach. The dollar is not dead. It’s not even on life support. If anything, it’s doing push-ups in the gym, getting ready to flex on the haters. Here’s why I’m so bullish on the USD, and why you should be too.
1. The Reserve Currency Superpower
The USD is the world’s reserve currency, and that’s not just a fancy title—it’s a superpower. Over 88% of global transactions (SWIFT data, 2024) are settled in USD. When Russia wants to sell gas to China, they often price it in dollars. When Brazil buys soybeans from Argentina, guess what? Dollars. Even countries with beef against the U.S. (looking at you, Iran) hold USD reserves because it’s the only currency universally accepted for trade.
Why does this matter? Because every country needs USD to play in the global sandbox. India’s not paying Canada for oil in rupees. They’re converting to USD or dipping into their dollar reserves. This creates constant demand for the greenback, and that demand isn’t vanishing overnight. Could it fade in a decade? Maybe. But in 2025? No chance.
And let’s talk alternatives. Bitcoin? Ha! It’s a speculative asset, not a stable currency for trade. Gold? It’s mooning (up 25% in 2025, per Bloomberg), but you’re not paying for a tanker of crude with gold bars. A BRICS currency? Good luck getting 10+ countries with conflicting agendas to agree on a logo, let alone a monetary policy. The USD’s reserve status is a fortress, and it’s not crumbling anytime soon.
2. Interest Rate Domination
Let’s talk money—specifically, where it flows. The U.S. has a Fed funds rate of 4.25–4.5%, while the Eurozone’s at 2.25%. That’s a 2% gap, which is like the Grand Canyon in forex terms. If you’re an investor, where are you parking your cash? In the U.S., where you’re earning a 2% real return (4.25% minus 2.4% inflation), or in the Eurozone, where you’re getting a big fat zero (2.25% minus 2.2% inflation)?
This is why the Eurozone’s in trouble. The ECB’s stuck in a trap—low rates to prop up struggling economies like Spain and Italy, but that makes the euro less attractive. Meanwhile, the U.S. is the cool kid at the party, attracting capital like moths to a flame. And don’t forget: the Eurozone’s a mess of 20 countries with one monetary policy but wildly different fiscal policies. Spain’s productivity isn’t Germany’s, no matter what the ECB pretends. The euro’s gonna weaken against the USD, mark my words.
3. Trump’s Dollar Rocket Fuel
Love him or hate him, Trump’s policies are about to light a fire under the USD. His “America First” agenda includes bringing manufacturing back to the U.S., which means building factories from scratch. Those factories need raw materials—steel, copper, you name it. And guess what currency they’ll use to buy that stuff? Ding, ding, ding—USD!
Plus, Trump’s tariffs (10–20% on imports, 60% on China, per Reuters) will reduce U.S. imports, meaning fewer dollars flowing out of the country. But foreign countries still need USD to repay their dollar-denominated debts (global USD debt is $13 trillion, per the BIS). Less USD supply, same demand? That’s a recipe for a stronger dollar. Trump’s shaking markets like a toddler with a snow globe, but in this case, it’s bullish for the USD.
4. Contrarian Goldmine
Here’s a little trading wisdom: when everyone’s screaming the same thing, they’re usually wrong. Right now, 99% of the finance world (or at least the loud ones on X) is saying the dollar’s toast. That kind of extreme sentiment is a red flag. Markets love to screw over the crowd, and when everyone’s shorting the USD, it means the bottom is either in or damn close.
I’m calling it: the DXY’s either bottomed already or will soon, probably around 97. When sentiment’s this bearish, it’s like the market’s handing you a gift-wrapped opportunity. And I’m not about to let it pass.
The Charts Don’t Lie: DXY Technical Breakdown
Alright, enough macro talk—let’s get to the fun stuff: charts. I’ve been staring at these squiggly lines for 20+ years, and they’re telling me the USD’s about to go on a tear. Let’s break it down, from the big picture to the nitty-gritty.
Long-Term View: The 20-Year Monthly Chart
Zoom out, fam. When in doubt, zoom out. I’m looking at the DXY on a monthly chart, going back to 2005. Each candle is one month, and the trend is crystal clear: up. The DXY’s been cruising in an ascending channel for two decades, like a train chugging along at 200 miles an hour. Sure, it’s hit some bumps—2008, 2011, 2020—but the direction’s undeniable.
Right now, the DXY’s sitting around 100, down from its 2024 highs. But it’s still within that bullish channel. I’m drawing trendlines here: a lower trendline connecting the lows (around 97–98) and an upper trendline around 120–125. The price is hugging the lower end, which screams “buying opportunity” to me.
My big-picture call? The DXY’s heading to 115–117 by late 2026 or early 2027, maybe even sooner (Jan 2026, anyone?). Why? Because a 20-year trend doesn’t reverse overnight. The dollar’s not dying—it’s just taking a breather before the next leg up. If you disagree, hit the comments. Let’s duke it out.
Short-Term View: The 4-Hour Chart
Now, let’s zoom in to the 4-hour chart for the past couple of months. The short-term trend’s been down, no question—DXY’s been sliding like a kid on a waterslide. But here’s where it gets juicy: I’m seeing a textbook inverse head-and-shoulders pattern. For the newbies, that’s a bullish reversal pattern, and it’s already played out like a charm.
Pattern Breakdown: The left shoulder formed in early April, the head hit a low around April 10, and the right shoulder wrapped up by April 21. The neckline (resistance) was around 99.8–100, and guess what? The DXY broke it like a champ.
Trendline Break: On top of that, the DXY smashed through a short-term downtrend line, confirming the bullish vibes.
RSI Divergence: Check the Relative Strength Index (RSI). From April 10 to April 21, the price made lower lows, but the RSI was making higher lows. That’s a classic bullish divergence, screaming, “The momentum’s shifting!” We jumped in when the trendline broke, and boom—profits are rolling in.
Price Targets and Trading Plan
Here’s the game plan, fam. The DXY’s already broken the neckline, so we’re in. Now, we’re watching these levels:
Immediate Target: 100.28
The DXY needs to close above 100.28 by the weekend (May 2–3, 2025). If it does, it’s go time. I’m telling you, go all in (responsibly, of course). This level’s key because it’s a minor resistance from prior price action. A close above it confirms the breakout.
Next Target: 103–103.5
This is the big one. The 103 zone is a major inflection point—tons of price action and clutter from earlier this year. If the DXY breaks 100.28, it’s got a clear path to 103. Expect some resistance around 100.27 (a support-turned-resistance level), but once it clears that, it’s smooth sailing to 103.
Probability: I’m giving this an 80% chance of heading higher, 20% chance of a pullback. Those are odds I’ll take any day.
Long-Term Goal: If the DXY follows its 20-year channel, we’re looking at 115–117 by 2026–2027. That’s not a pipe dream—that’s history repeating itself.
Trading Tip: We’re already positioned from the trendline break. If 100.28 breaks, scale up. If it pulls back to 97 (the lower trendline), that’s a dream buy zone. But don’t get caught in the daily noise—Trump’s tweets, CPI reports, whatever. Focus on the big picture.
Gold, Tariffs, and Trump: The Side Characters
I know you’re itching to talk gold, tariffs, and Trump’s wild ride. I’m saving the deep dive for another post (stay tuned!), but here’s the quick and dirty.
Gold: Gold’s up 25% in 2025 (Bloomberg), and everyone’s like, “See? Dollar’s dead!” Nah, fam. Gold’s ripping because of tariff fears, geopolitical chaos, and central banks hoarding it like Smaug. It’s not a dollar killer—it’s just doing its own thing. We’ll break it down soon.
Tariffs: Trump’s tariff plans (10–20% on imports, 60% on China) are shaking markets. They’ll make imports pricier, reduce USD outflows, and boost domestic demand for dollars. Bullish for USD, bearish for emerging markets. More on this later.
Trump: The man’s a market wrecking ball. He’s out here calling for lower rates one day, tariffs the next, and probably tweeting about aliens by Friday. But his manufacturing push and tariff policies are USD rocket fuel. Ignore the noise—focus on the policy.
Why You Should Care (And How to Profit)
Look, I get it. You’re not here for a PhD in economics—you’re here to make money. So, why should you care about the USD? Because it’s the backbone of the forex market, and where the DXY goes, opportunities follow. A stronger dollar means:
Forex Trades: Go long USD/EUR, USD/JPY, or even USD/CAD. The euro’s toast with that 2.25% rate, and the yen’s stuck in Japan’s low-rate purgatory (0.25%, per BOJ).
Stock Market Impact: A stronger USD could pressure U.S. multinationals (exports get pricier) but boost domestic firms. Think Walmart, not Apple.
Commodities: Oil and metals (priced in USD) could dip as the dollar rises. Short crude if you’re feeling spicy.
Emerging Markets: Countries with USD debt (like Turkey or Argentina) are gonna feel the heat. Avoid their currencies like the plague.
Here’s how we’re playing it at Edge-Forex:
Long DXY: We’re in at the trendline break, scaling up if 100.28 breaks. Target 103, then 115 long-term.
Risk Management: Keep stops tight below 99.5 (short-term) or 97 (long-term). Don’t bet the farm—markets love surprises.
Stay Nimble: Watch for Fed signals, ECB moves, or Trump’s next X rant. We’ll adjust as needed.
The Big Picture: Don’t Get Lost in the Noise
I know it’s tempting to get sucked into the daily drama—Trump’s latest outburst, a hot CPI print, or some X influencer shilling a “dollar crash” thesis. But trading’s about cutting through the noise. Zoom out. Look at the 20-year DXY chart. Look at the interest rate gap. Look at the USD’s reserve status. The dollar’s not going anywhere, and it’s about to remind everyone why it’s the boss.
My advice? Get out of the short-term clutter. Stop refreshing X every five minutes. Focus on the trends that matter: central bank rates, capital flows, and technical setups. The DXY’s setting up for a monster move, and we’re gonna ride it like surfers on a tsunami.
Wrapping It Up: Let’s Make Some Freaking Money
Alright, Edge-Forex fam, that’s the deal. The dollar’s not dead—it’s just been napping, and it’s about to wake up with a vengeance. The DXY’s forming a bottom, the charts are screaming “buy,” and the macro setup (rates, Trump, reserve status) is a bullish trifecta. We’re already positioned, and if 100.28 breaks, we’re going big.
I’m back, baby, and I’m here to drop regular updates, roast the haters, and help us all stack some serious profits. Got questions? Drop ‘em in the comments. Disagree with my DXY call? Bring it on—let’s debate. Just don’t be that guy shorting the dollar while the rest of us are cashing checks.
Stay tuned for the next post (gold’s getting its moment soon), and let’s make some freaking money together. Out!
DOLLARINDEX trade ideas

Dollar Weekly CLS I Continuation setup Model 2 , Target 50%Hey, Market Warriors, here is another outlook on this instrument
If you’ve been following me, you already know every setup you see is built around a CLS range, a Key Level, Liquidity and a specific execution model.
If you haven't followed me yet, start now.
My trading system is completely mechanical — designed to remove emotions, opinions, and impulsive decisions. No messy diagonal lines. No random drawings. Just clarity, structure, and execution.
🧩 What is CLS?
CLS is real smart money — the combined power of major investment banks and central banks moving over 6.5 trillion dollars a day. Understanding their operations is key to markets.
✅ Understanding the behaviour of CLS allows you to position yourself with the giants during the market manipulations — leading to buying lows and selling highs - cleaner entries, clearer exits, and consistent profits.
🛡️ Models 1 and 2:
From my posts, you can learn two core execution models.
They are the backbone of how I trade and how my students are trained.
📍 Model 1
is right after the manipulation of the CLS candle when CIOD occurs, and we are targeting 50% of the CLS range. H4 CLS ranges supported by HTF go straight to the opposing range.
📍 Model 2
occurs in the specific market sequence when CLS smart money needs to re-accumulate more positions, and we are looking to find a key level around 61.8 fib retracement and target the opposing side of the range.
👍 Hit like if you find this analysis helpful, and don't hesitate to comment with your opinions, charts or any questions.
⚔️ Listen Carefully:
Analysis is not trading. Right now, this platform is full of gurus" trying to sell you dreams based on analysis with arrows while they don't even have the skill to trade themselves.
If you’re ever thinking about buying a Trading Course or Signals from anyone. Always demand a verified track record. It takes less than five minutes to connect 3rd third-party verification tool and link to the widget to his signature.
"Adapt what is useful, reject what is useless, and add what is specifically your own."
— David Perk aka Dave FX Hunter ⚔️

The Most Important Chart Right NowThe Dollar Index is one of the most important charts right now. A weak dollar means looser financial conditions. This is good for US stocks, bitcoin and gold.
The fundamentals are bearish. Both the US and China want a weaker dollar. There are issues in the US bond market, and it's a self-reinforcing cycle as US stock positions need to be currency hedged.
The backdrop to all this is, of course, massive debt and dollar debasement with more money printing on the horizon.
I like the technical picture here, and it's not a bad spot to add to shorts or enter fresh ones. Ideally, we see a pullback to 1.12 on the EUR, but we might not get it, so adding a bit now here is ok.
As always, remember trading is about risk-adjusted returns, so use a stop and keep your position size small unless you are very experienced.

DXY 4HR , Daily AnalysisThe DXY is expected to make a minor bullish move until it reaches the 101.56 level. From there, a bearish reversal is anticipated, potentially driving the index lower until it forms a new lower low or reaches the key support zone between 96.80 and 95.40. At that level, a significant bullish reversal or a strong upward movement is likely to occur.

DXY updateDaily fractals shifted to bullish But the overall daily swing is bearish
so it might be counted as a retracement of the overall trend.
there is a supply zone upside high probs for price to tab 101 level .
In 2h fractals shift for upside has happened after a liq-swept .
so to conclude short time bearish trend gonna happend for xxx / usd pairs
and bullish for usd / xxx...

Dxy bullish idea for next week - MMBMThis is a bullish possibility for DXY price action for next week.
Monthly:
- Price took a swing low confluent with a bearish breaker in discount and closed above the level;
Weekly:
- Price Took a swing below monthly swing with a bullish reaction. If this week closes with above previous weeks high, it confirms a bullish weekly swing;
Daily:
- Monday printed the likelly low of the week
- A daily fair value gap is open allow with a volume imballance around monday open signalling bullish price action - a retrace to these levels would be a good buying opportunity.
4h:
- there is a market maker buy model in play.
- as of now, price already printed an intermidiate term low signalling that low risk buy myght have happened.
News forecast:
- I expect NFP to either retrace price to daily fvg or daily volume imbalance and leave a bullish reaction.
- FOMC next week might bring the volatility to complete the mmbm
Thank you for reading

USDX,DXYUSDX price is near the important support zone 98.23-97.75. If the price cannot break through the 97.75 level, it is expected that in the short term there is a chance that the price will rebound.
**Very Risky Trade
🔥Trading futures, forex, CFDs and stocks carries a risk of loss.
Please consider carefully whether such trading is suitable for you.
>>GooD Luck 😊
❤️ Like and subscribe to never miss a new idea!

A Brief Summary of Trump's 100 Day and Effects on U.S. EconomyOverview
In the 2024 campaign, Donald Trump proposed an aggressive "America First" economic agenda. His key proposals centered around four pillars: tariffs and trade, tax policy, energy and environment, and regulatory changes . These proposals built upon his first-term policies but were more sweeping and intense.
Key Proposals
1. Tariffs & Trade
Universal import tariffs of 10–20% across all goods.
60% tariffs on Chinese imports , plus targeted tariffs on Mexico and Canada (linked to immigration and drug policy).
Threatened reciprocal tariffs and 100% tariffs on BRICS nations .
Proposed tariffs on U.S. companies that offshore production.
2. Taxes & Fiscal Policy
Make all 2017 Tax Cuts and Jobs Act provisions permanent (individual, corporate, estate taxes).
Lower corporate tax rate to 20% or 15% for domestic production.
Expand tax credits for “ Made in America ” goods, SALT relief, caregiver and overtime pay.
Analysts estimate a $5–11 trillion reduction in federal revenue over a decade due to these cuts.
3. Energy & Environment
Rescind Biden-era climate regulations, including EPA emissions standards and clean-energy mandates.
Repeal unspent Inflation Reduction Act (IRA) funds, ending subsidies for EVs, solar, wind, and batteries.
Open federal lands and waters for fossil fuel production, aiming to boost oil output by 3 million barrels/day .
4. Deregulation & Crypto
Slash regulations in energy, finance, and technology sectors.
Promote crypto: proposed a government Bitcoin reserve and replacing SEC leadership.
Vowed to cut federal bureaucracy and fast-track project permitting.
Projected Economic Impact (2024–2026)
GDP Growth
Analysts predict modestly slower growth under Trump.
High tariffs may reduce long-run GDP by 6% and wages by 5% , per Penn Wharton Budget Model.
Tariff effects are projected to outweigh gains from tax cuts and deregulation.
Employment
Slower GDP growth would moderate job gains.
Tariffs could hurt export industries and raise input costs.
Deregulation and tax incentives may support hiring in energy and construction.
Inflation
Most economists agree Trump’s tariffs would raise consumer prices.
Combined with deficit-financed tax cuts, inflation could rise 4–7 percentage points above baseline by 2026.
This would likely delay or reverse Fed rate cuts.
Interest Rates
Rising inflation would pressure the Federal Reserve to keep rates higher for longer.
Bond markets have already priced in higher yields in response to Trump’s proposed tariffs.
Stock Market
Markets initially rallied on tax and deregulation hopes.
Bitcoin hit all-time highs; S&P 500 surged post-election.
However, trade war fears caused sell-offs in early 2025, especially in tech and consumer sectors.
Business & Consumer Sentiment
Business leaders expressed concern over trade uncertainty.
Consumer polls show widespread fear of rising prices.
CEO confidence rose post-election due to expected pro-business policies, despite tariff concerns.
Summary Outlook
GDP growth expected to slow below the ~ 2.8% pace of late 2024.
Inflation likely to climb above 3% , driven by tariffs and fiscal stimulus.
Interest rates may remain high due to inflationary pressures.
Markets may oscillate—rallying on tax cuts but reacting negatively to trade disruptions.
Overall effect is mixed: pro-growth tax cuts and deregulation may not fully offset the drag from trade and inflation risks.
Sources
Tax and Fiscal: Tax Foundation, Committee for a Responsible Federal Budget (CRFB)
Trade and Tariffs: Center for Strategic and International Studies (CSIS), Penn Wharton Budget Model
Energy and Environment: NPR, Thomson Reuters, Hoover Institution
Macroeconomic Impact: Hoover Institution, Stanford Institute for Economic Policy Research (SIEPR), Peterson Institute
Market Reaction: Reuters, ABC News, AP, Bloomberg
Sentiment Surveys: PwC, Conference Board, PBS, ABC/Washington Post

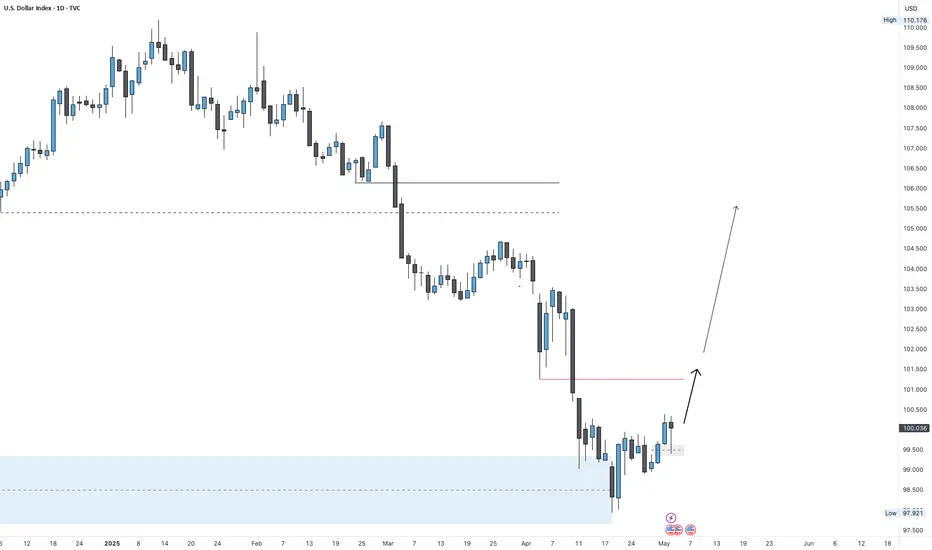
DXY Ready to Pop – Watch That 100 Break!After breaking below the key psychological level at 100 and making a low just under 98, the Dollar Index ( TVC:DXY ) has entered a consolidation phase.
Over the past three weeks, price has developed an inverted head and shoulders pattern, with the neckline perfectly aligning with the horizontal resistance at 100 — a strong zone of confluence from both a technical and psychological standpoint.
Despite the current hesitation under resistance, the structure suggests bullish potential. I believe we are approaching a breakout above 100, and once that happens, an acceleration to the upside is likely to follow.
🎯 Target: 102
🔒 Invalidation: A break below 98 would cancel the bullish bias.
As long as the price stays above the 98 area, I remain bullish and expect the dollar to strengthen.
🚀 The breakout hasn’t happened yet — but the pressure is building.

Bearish reversal?US Dollar Index (DXY) is rising towards the pivot and could reverse to the 1st support.
Pivot: 100.51
1st Support: 97.85
1st Resistance: 101.83
Risk Warning:
Trading Forex and CFDs carries a high level of risk to your capital and you should only trade with money you can afford to lose. Trading Forex and CFDs may not be suitable for all investors, so please ensure that you fully understand the risks involved and seek independent advice if necessary.
Disclaimer:
The above opinions given constitute general market commentary, and do not constitute the opinion or advice of IC Markets or any form of personal or investment advice.
Any opinions, news, research, analyses, prices, other information, or links to third-party sites contained on this website are provided on an "as-is" basis, are intended only to be informative, is not an advice nor a recommendation, nor research, or a record of our trading prices, or an offer of, or solicitation for a transaction in any financial instrument and thus should not be treated as such. The information provided does not involve any specific investment objectives, financial situation and needs of any specific person who may receive it. Please be aware, that past performance is not a reliable indicator of future performance and/or results. Past Performance or Forward-looking scenarios based upon the reasonable beliefs of the third-party provider are not a guarantee of future performance. Actual results may differ materially from those anticipated in forward-looking or past performance statements. IC Markets makes no representation or warranty and assumes no liability as to the accuracy or completeness of the information provided, nor any loss arising from any investment based on a recommendation, forecast or any information supplied by any third-party.

DXYIf we look at nature's theory , we can define see that the impulsive phase is to the upside and the market corrects to the down side.
We have a clear uptrend with 2 confirmed touches and now anticipating a bullish impulse on the third touch
The third touch is also a third touch of a pattern with 2 confirmed touches waiting for the final touch to go
Multiple confirmations

DXY Outlook: FVG Retest Complete — Is 105 the Next Sweep?DXY Weekly Forecast
In recent weeks, DXY dropped to the extreme demand zone, sweeping the lows around 98–99, before launching a bullish reversal and breaking through multiple minor highs.
Last Friday, price retested a daily Fair Value Gap — perfectly aligned with the NFP release — and held. Now, we may see some sideways consolidation at this level before continuation higher toward the 105.000 zone, where key liquidity sits above prior highs.
Bias: Bullish
Key Zones:
• Support: 102.000 (FVG / demand area)
• Resistance: 105.000 (liquidity target)
The structure is clean: bulls in control, as long as the FVG zone holds.
—
Weekly forecast by Sphinx Trading
Drop your thoughts in the comments.
#DXY #DollarIndex #USD #ForexAnalysis #LiquiditySweep #SphinxWeekly #FairValueGap #NFP #SmartMoney
DXY Technical Analysis – Bearish BiasDXY Technical Analysis – Bearish Bias
Market Structure: The price attempted a recovery but failed to break above a strong supply/resistance zone around 99.30–99.40.
Price Action: A rounded bottom (U-shape) move formed, but instead of continuation, the price rejected the resistance and started to fall.

Dollar Bounce to 103 Incoming or Straight to 96?Will the Dollar Keep Tumbling, or Are We About to Bounce Back to 103 in May?
Checking out the monthly charts, April finally delivered a close under that critical 100 level, breaking a floor that held firm for years:
Zooming into the weekly chart, we’ve retraced back to test the 100 level from below. It’s now acting as resistance—so, is another big drop coming?
Long term, my bias is clear: the dollar looks set to keep sliding lower after breaking the crucial 100 mark. But if we flip to the daily charts, we can clearly see signs of a short-term bounce brewing. It looks like price might want to squeeze back inside the range, aiming for that juicy sell zone around the 103 mark—the very origin of the leg down that initially broke 100:
This 103 area is a prime spot for short-term bulls, and an even better opportunity to start loading up on shorts for a move down towards the Monthly buy zone around 96.
Personally, I won’t trade USDX directly to the upside—I'll instead use this analysis to play setups on pairs like EURUSD and AUDUSD, as they're approaching key resistance areas right now.
My game plan: wait patiently for price to reach around 103, then start hunting for sell signals. But first, we’ll need a solid daily close back above 100, something I think we could see happen this week.
Don’t forget—we’ve got the Fed’s interest rate decision coming up, which might trigger some volatility. We could easily rally up to 103 ahead of the decision and then see a sell-off afterward. Of course, if the Fed throws us a curveball, the dollar might never get back above 100, and just continue dropping straight away.
Right now, the 100 level is crucial—so watch closely.
What’s your take? Drop your thoughts below! 😊

"DXY Dollar Index" Market Bullish Heist Plan (Day/Swing Trade)🌟Hi! Hola! Ola! Bonjour! Hallo! Marhaba!🌟
Dear Money Makers & Robbers, 🤑 💰💸✈️
Based on 🔥Thief Trading style technical and fundamental analysis🔥, here is our master plan to heist the "DXY Dollar Index" Bank Heist. Please adhere to the strategy I've outlined in the chart, which emphasizes long entry. Our aim is to escape near the high-risk ATR Line Zone. It's a Risky level, overbought market, consolidation, trend reversal, trap at the level where traders and bearish robbers are stronger. 🏆💸"Take profit and treat yourself, traders. You deserve it!💪🏆🎉
Entry 📈 : "The heist is on! Wait for the Crossing previous high (100.400) then make your move - Bullish profits await!"
however I advise to Place Buy stop orders above the Moving average (or) Place buy limit orders within a 15 or 30 minute timeframe most recent or swing, low or high level for Pullback entries.
📌I strongly advise you to set an "alert (Alarm)" on your chart so you can see when the breakout entry occurs.
Stop Loss 🛑: "🔊 Yo, listen up! 🗣️ If you're lookin' to get in on a buy stop order, don't even think about settin' that stop loss till after the breakout 🚀. You feel me? Now, if you're smart, you'll place that stop loss where I told you to 📍, but if you're a rebel, you can put it wherever you like 🤪 - just don't say I didn't warn you ⚠️. You're playin' with fire 🔥, and it's your risk, not mine 👊."
📍 Thief SL placed at the nearest/swing low level Using the 2H timeframe (99.000) Day/swing trade basis.
📍 SL is based on your risk of the trade, lot size and how many multiple orders you have to take.
🏴☠️Target 🎯: 102.300
🧲Scalpers, take note 👀 : only scalp on the Long side. If you have a lot of money, you can go straight away; if not, you can join swing traders and carry out the robbery plan. Use trailing SL to safeguard your money 💰.
💰💵💸"DXY Dollar Index" Bank Money Heist Plan is currently experiencing a bullishness,., driven by several key factors. .☝☝☝
📰🗞️Get & Read the Fundamental, Macro Economics, COT Report, Geopolitical and News Analysis, Sentimental Outlook, Intermarket Analysis, Index-Specific Analysis, Future trend targets with Overall outlook score... go ahead to check 👉👉👉🔗🔗🌎🌏🗺
⚠️Trading Alert : News Releases and Position Management 📰🗞️🚫🚏
As a reminder, news releases can have a significant impact on market prices and volatility. To minimize potential losses and protect your running positions,
we recommend the following:
Avoid taking new trades during news releases
Use trailing stop-loss orders to protect your running positions and lock in profits
💖Supporting our robbery plan 💥Hit the Boost Button💥 will enable us to effortlessly make and steal money 💰💵. Boost the strength of our robbery team. Every day in this market make money with ease by using the Thief Trading Style.🏆💪🤝❤️🎉🚀
I'll see you soon with another heist plan, so stay tuned 🤑🐱👤🤗🤩

US DOLLAR INDEX TO RISE TO 100.90Dear traders, based on the chart, the falling trend-line is clearly broken and retested and the price is supported by a rising trend-line as well. This implies a big possibility of further rise towards 100.90. Let's See!

DXY (Dollar index) Shorts from 1hr supply zone My general outlook on the DXY this week leans bearish, as I expect price to continue trending lower. I’ve identified a nearby 1H supply zone, where we could see price react and begin pushing lower. There is also a larger supply zone further above, but it’s currently out of reach unless price pulls back significantly.
Looking back, the 2-day demand zone I marked over a week ago has played out well, with a strong bullish reaction from that level — price is still rising from that zone. During this move, a new 11H demand zone has formed, which also led to a change of character to the upside. If price revisits that zone, we may see another bullish continuation from there.
Key Points:
Overall bearish trend expected to continue in the short term.
1H supply zone nearby is a potential trigger point for a sell-off.
2D demand zone previously marked is still holding and influencing price.
11H demand zone has caused a bullish shift and could provide another long opportunity if price returns.
P.S. This is my general DXY outlook for the week. I don’t trade the dollar directly, but I use it as a key confluence when analysing and executing trades across other major pairs.

DXY Printing a Bullish Triangle??The DXY on the 1 Hr Chart is forming a potential continuation pattern, the Bullish Triangle!
Currently Price is testing the 99.6 - 99.8 Resistance Area and battling with the 200 EMA and 34 EMA Band. The reaction to this conjunction could be pivotal in who overcomes: Buyers or Sellers.
Now during the formation of the potential pattern, Price on the RSI has stayed relatively Above the 50 mark being Bullish Territory suggesting Buyers could win the Bull-Bear battle.
Until Price breaks either the Resistance Area or the Rising Support, we will not have a definitive direction in which USD will strengthen or weaken.
*Wait For The Break*
-If Price breaks the Resistance Area, USD will strength possibly heading to the 100.8 - 101 Area
-If Price breaks the Rising Support, USD will weaken possibly heading to the 98.5 - 98.3 Area
Fundamentally, it is said China and USA are possibly getting closer to potentially ending the Reciprocal Tariff War going on with both sides willing to negotiate.
With the USA being the #1 Consumer of Goods globally, other economies can not afford us to not buy their things so I continue to see the Tariff War more as a Strong-Arm for the USA to be able to negotiate better terms!
USD News:
JOLTS - Tuesday, Apr. 29th
GDP - Wednesday, Apr. 30th
Unemployment Claims / ISM Manu. PMI - Thursday, May 1st
Non-Farm Employment Change / Avg Hourly Earnings / Unemployment Rate - Friday, May 2nd
For all things Currency,
Keep it Current,
With Novi_Fibonacci

DXY Forecast: More Bearish OrderflowThis week, I anticipate further downside movement on the DXY, with price potentially reaching a key area of interest—a bullish order block. While the reaction at this level remains uncertain, my current bias remains bearish unless a break of structure to the upside signals a continuation of the bullish trend.

My Thoughts #004My thoughts are that the pair will buy...
The daily trend is very much bearish and with trend once it have made a new low(LL)
We need to see it printing a new High(LH)
Confirmation??
I see a Choch and the market is creating Highs confirmation for the new High(LH)
The pair might just sell
So use proper risk management
Let's do the most

DXY Bullish Breakout Within Ascending ChannelThis 4-hour chart of the US Dollar Index (DXY) shows price trading within an ascending channel, currently testing a resistance zone around 100.50–100.80. If the resistance holds, a pullback to the lower boundary of the channel or the highlighted retest zone near 99.50 is possible. However, a breakout above resistance may lead to further bullish continuation toward the marked 1st and 2nd target zones above 101. The chart also highlights recent change-of-character (ChoCH) signals, suggesting a shift toward bullish momentum.
TP1 (1st Target): Around 100.85 – 101.00 — just above the current resistance zone.
TP2 (2nd Target): Around 101.40 – 101.50 — the upper boundary of the ascending channel.
Note: If the market does not retest and breaks directly above the resistance zone, we will enter a buy position on the breakout and aim for targets at 100.85 (TP1) and 101.50 (TP2).

US Dollar Bulls Return Ahead of NFPsThe US Dollar is testing resistance today at the 2023 / 2024 low day closes (LDC) at 99.95-100.42- looking for possible infection off this mark in the days ahead.
A closer look at USD price action shows the index trading into the resistance at the median-line in early U.S. trade. A topside breach above this threshold is needed to validate a breakout of the weekly opening-range with subsequent resistance see at the September high-day close (HDC) / September high at 101.77/92. Note that channel resistance converges on this threshold over the next few weeks and a breach / close above this slope would be needed to suggest a more significant low was registered last week / a larger reversal is underway. Subsequent resistance eyed at the 2016 high-close / 2020 high at 102.95/99 and the 2023 yearly open at 103.49.
Key support remains unchanged at the 2018 swing high / 61.8% retracement of the 2018 advance at 97.71-98.39- a close below this threshold would threaten another bout of accelerated USD losses with subsequent support seen at the 96-handle, the 2022 LDC at 95.17 and the March 2020 low at 94.65.
A rebound off key support takes the U.S. Dollar into initial resistance with major event risk on tap tomorrow. From a trading standpoint, losses should be limited to this week’s low IF price is heading higher on this stretch with a breach above 100.42 needed to fuel the next leg of the recovery.
-MB

DXY Analysis: Head & Shoulders or a Bull Trap? Despite a notable contraction in U.S. GDP and a sharp drop in Core PCE — both pointing to increasing recession risk — the U.S. Dollar Index (DXY) managed to sustain its rebound.
On the 4-hour chart, DXY is pushing above the neckline of an inverted head-and-shoulders formation. However, confirmation is still needed — a clean hold above 100.30 is essential to avoid a bull trap.
Upside Levels in Sight (if 100.30 holds):101.30 - 102.00 - 103.50
Downside Risk (if neckline fails):99.30 - 98.90 - 98.00
From a monthly perspective, DXY is holding above the 98 support and remains above the lower border of the up-trending channel extending from the 2008 lows, paving the way for another possible drop this year towards that border should the 98-support be decisively breached.
From a daily momentum perspective, the overall picture may signal a short-term trend reset before markets regain directional clarity
Written by Razan Hilal, CMT
