DXYDXY 99.418 Bearish Target – Summary:
99.418 is likely a key support level or technical target based on chart patterns or retracement levels.
It marks a potential bounce zone or short-term bearish goal before deeper levels like 98 or 95.
Break below 100 and weak momentum indicators support the move toward 99.418.
If DXY holds above 99.418, it may trigger a short-term rebound.
DOLLARINDEX trade ideas

DXY Expected to Decline TomorrowDXY is expected to decline tomorrow, with potential for a maximum rise to the 101 resistance area accompanied by upper shadow formation.
A rising wedge pattern has formed, with stochastic in the overbought region, and there's a possibility of rejection at the dynamic resistance level.


DXY Bullish Based on price Action, this is a swing long with a 1:4 RR
Target is there as we have pending buy side liquidity that was left for future run
DXY:Sharing of the Latest Trading StrategyAll the trading signals today have resulted in profits!!! Check it!!!👉👉👉
Today, the 4-hour chart of the DXY shows a volatile downward trend, and it is currently testing the support area of 99.40 - 99.30. Overall, it remains in a downtrend. Pay attention to the resistance near 100.00 above and the support near 99.00 below. Wait for a rebound and then go short.
Trading Strategy:
sell@100.00-99.80
TP:99.00-98.80
The signals in the Signature have brought about continuous profits, and accurate signals are shared every day. Hurry up and click to get them!
👇 👇 👇 Obtain signals👉👉👉

DXY:Sharing of the Trading Strategy for Next Week This week’s trading wrapped up successfully. Our exclusive VIP trading signals achieved a 90% accuracy rate!
Recently, the economic data of the United States has shown mixed performance. The non-farm payrolls added in April were higher than expected, but the data for March was revised downward, and the number of initial jobless claims also exceeded expectations. Overall, the U.S. Dollar Index still has a trend of fluctuating. Pay attention to the resistance level of 100.3742 above and the support level of 99.2702 below. In terms of trading operations, it is mainly advisable to take short positions on rebounds.
Trading Strategy:
sell@100.3000-100.0000
TP:59.5000-59.0000
The signals in the Signature have brought about continuous profits, and accurate signals are shared every day. Hurry up and click to get them!
👇 👇 👇 Obtain signals👉👉👉

DXY Bullish Gartley pattern—look for buy opportunities. Demand zone and the market is doing higher high.

USXUSD H4 FTB FrameworkUSXUSD H4 FTB Framework
NFP High is weak.
Let's see if Medz is right once again.

DXY (LONG)
Inverse Head and Shoulders pattern
Which Serves as reversal pattern
Dollar strength coming

$USD Breaks Down – “Mission Accomplished” or Just Getting📉 The US Dollar Index ( AMEX:USD / TVC:DXY / $USINDEX) has officially broken beneath the multi-year support zone from 2020, right as Trump prepares to declare "Mission Accomplished".
From Inauguration to Liberation Day, and now the final stage: Meltdown.
🧭 Key Events Marked:
🟥 Inauguration
🟥 Trade War
🟥 Liberation Day
🟩 Mission Accomplished
🔻 Meltdown incoming?
📊 The breakdown aligns with a sharp spike in Nasdaq down volume (see chart). This isn't just a currency move — it's a market-wide stress signal.
Watch closely:
TVC:DXY below 99 = structural weakness.
Risk-on assets may melt up temporarily, but volatility could snap back fast.
Global currency pairs ( FX:EURUSD , FX:USDJPY , FX:GBPUSD ) are all on alert.

DOLLARThe U.S. Dollar Index (DXY) is currently in a bearish phase, trading near 98.93 as of late April 2025, down from 99.71 earlier in the month. Key drivers include:
Political Uncertainty: Trump’s tariff policies (e.g., 25% levies on auto/semiconductor imports) and trade tensions have eroded the dollar’s safe-haven appeal, despite initial short-lived gains.
Fed Policy Expectations: Markets anticipate Fed rate cuts in 2025 if inflation cools, weakening the dollar. The Fed’s cautious stance in recent minutes has reinforced this outlook
Rising Treasury yields reflect inflation concerns and foreign selling, yet the DXY has weakened due to political risks and growth fears.
Basis trades (exploiting price gaps between Treasuries and derivatives) have amplified volatility, with an estimated $800B– MIL:1T at stake.
Divergence Signals:
The DXY-Treasury spread (usually correlated) has diverged, suggesting markets doubt the Fed’s ability to sustain higher rates despite sticky inflation. This divergence often precedes shifts in risk asset pricing.
Fed Policy Impact:
Fed minutes emphasize data dependency, delaying rate cuts until inflation eases convincingly. However, bond markets are pricing in 1–2 cuts by year-end, weakening the dollar.
Outlook and Critical Levels
Bond Yields: Likely to stabilize near 4.5% for 10-year Treasuries if inflation moderates, but geopolitical risks and tariff escalation could drive further volatility.
Conclusion
The DXY’s bearish bias persists amid political uncertainty and Fed dovishness, while bond markets face turbulence from inflation and foreign capital flows. Traders should monitor:
Fed rhetoric and U.S. inflation data (core PCE, CPI).
Geopolitical developments (U.S.-China trade talks, tariff adjustments).
This interplay suggests continued volatility, with the DXY likely to underperform unless Fed policy or risk sentiment shifts abruptly.

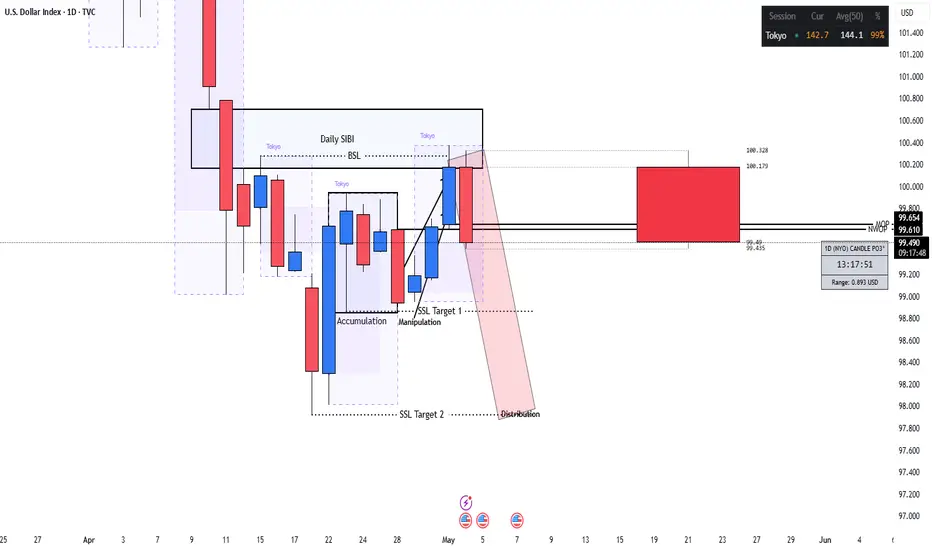
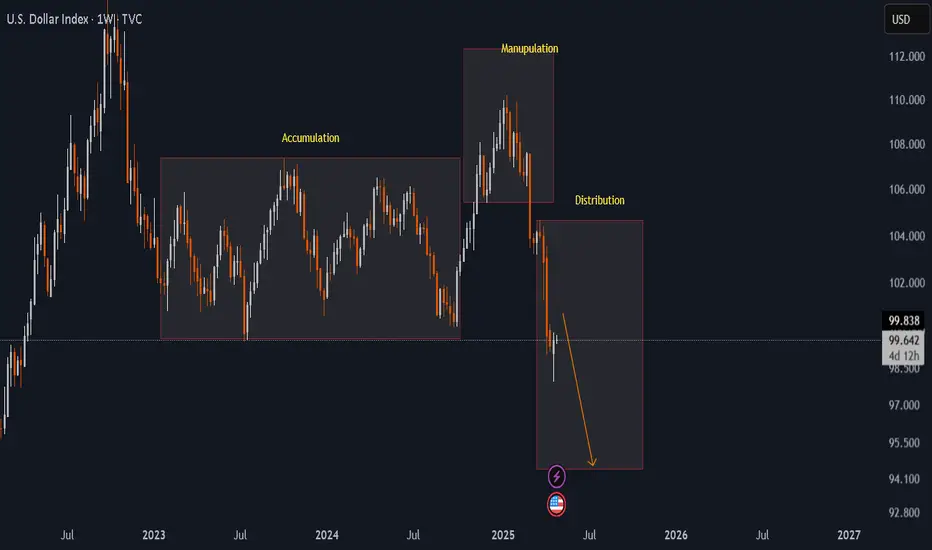
DXY updateDXY performing exactly what it performed when Last time TRump became president.
and Technically created a very clear AMD structure.
Now it is in Distribution zone...
DXY4h chartwe can see clearly a head and shoulders in DXY plus the last week make a big move to the down side, i think he looking for take a breath.

USD StrengthGiven the current technical indicators and fundamental backdrop, the DXY may continue to face downward pressure in the short term. However, strong economic fundamentals and potential shifts in Federal Reserve policy could provide support, leading to a stabilization or potential rebound.

possibility of uptrendThe upward trend is expected to start according to the specified directions and if the price breaks through the resistance area, confirmation of the upward trend will be possible.

Viper Sunday Weekly forecast call. NFP week!On Sunday's we review the markets and look at structure, trends and Candle charts to see what possibly could happen in the week ahead. With a Pullback last week, the markets look poised to have a stronger week leading into NFP.
We cover US30, NAS100, Gold, Oil and Forex pairs. As well as DXY.
Trade carefully, always use proper risk management and this video contains no trade calls or expected results. It is for education purposes only.

Price Action + Fundamentals Point to Dollar StrengthThe current market environment presents compelling evidence for a bullish move in the US Dollar Index (DXY). While some patience is required, the setup is increasingly favorable for the dollar to appreciate in the coming weeks and months.
Key Factors Supporting a Bullish Move:
Monthly Close Above 100.160:
A critical technical level to monitor is the monthly close above 100.160. If achieved, it would signal a strong bullish breakout, setting the stage for a continuation higher. Given current price action and market dynamics, this scenario looks highly probable. However, if the price fails to close above 100.160 and instead breaks below it, we could potentially start looking for short opportunities.
Bond Market Strength (30Y, 10Y, 5Y):
This past week, we witnessed notable strength across the US bond market. Yields declined as prices rose, typically a positive signal for the dollar as it reflects capital inflows into US assets.
COT Report Insights:
The Commitment of Traders (COT) report reveals a critical shift: commercial traders, often considered the "smart money," are beginning to accumulate long positions in the dollar. This change in positioning historically precedes significant bullish moves.
Seasonal Patterns:
Seasonality also favors the dollar during this period. Historically, the dollar tends to strengthen in the mid-year months, aligning perfectly with the current technical and fundamental landscape.
Targets:
Initial Target: 106.120
Given the accumulation signs and supportive macro backdrop, a move towards 106.120 seems very realistic.

Is the US Dollar Preparing for a Bullish Comeback?The DXY is currently maintaining a bullish setup amid trade negotiations, election developments, and anticipation of key leading U.S. economic indicators this week.
An inverted head-and-shoulders formation is visible on the 4-hour time frame. A decisive catalyst and a breakout above the 100.00 and 100.30 levels are needed to confirm a more sustained bullish bounce from multi-year lows, with targets at 102.00, 103.30, and 104.70 — reversing recent strength in major global currencies.
On the downside, a breach of the 97.00 level could trigger a decline toward the lower boundary of the long-term uptrend channel established since 2008, aligning with the 92.00 zone, and potentially lifting gold and major currencies globally.
Several key events this week could challenge or reinforce the current bullish setup amid ongoing Trump–China trade negotiations:
U.S. Advance GDP & Core PCE — Wednesday
BOJ Rate Decision & U.S. ISM PMI — Thursday
U.S. Non-Farm Payrolls — Friday
Mega Cap Earnings — Wednesday/Thursday
While long-term signals remain bearish, short-term charts suggest a potential bullish recovery, with trade negotiations likely to tip the balance.
Written by Razan Hilal, CMT

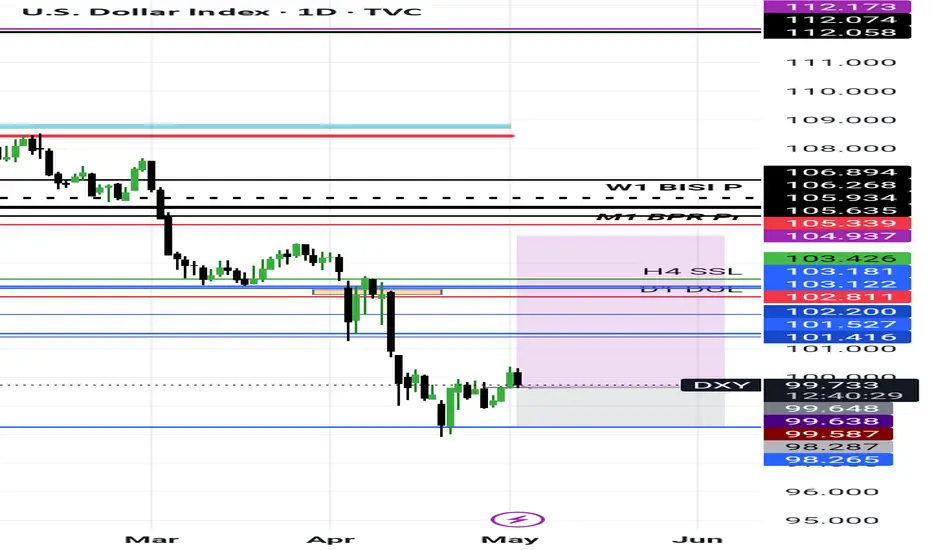
DXY 4H Chart AnalysisThe U.S. Dollar Index is currently consolidating near the 99.400 level, within a broader bearish trend. Price is sitting just above key H4 support (~99.000), making this a critical decision zone.
Bullish scenario: Rejection from 99.000 could lead to a retracement towards 100.000, and potentially 102.500 if momentum holds.
Bearish scenario: A break below 99.000 would confirm further downside, possibly targeting 97.500 and beyond.
Traders should wait for clear price action confirmation before committing to a direction.

USDX-BUY straegy Daily chart Regression channelThe USDX shows clearly we should be cautious in selling USD, and this applies across the board. Based on channel and the extreme case we are in, we can bounced back ttowards 101.20-101.70 area in the near term.
Strategy BUY @ 97.80 - 98.20 and take proft in stages 1. @ 100.37 and 2. 101.57.

DXY - Still survive on it Bullish ChanelThe dollar index is currently still in a bullish channel. This shows that there is still a fairly large possibility of reversing and making an upward movement,
As history showed us that 120 is DXY current target.

DXY TVC:DXY is currently struggling to break the resistance and support tho the support is most likely to pull back on 98.000 level for support bofore it shoots to the upside.
