Nasdaq 100 Prepares for Launch — Reclaiming Critical GroundNAS100 8H TECHNICAL ANALYSIS 💻🧠
OVERALL TREND
📈 UPTREND — Structure is shifting bullish. Recent higher lows and strong rebounds from April lows confirm the current upward momentum. This is supported by 12/13 Moving Averages flashing BUY , including critical 50- and 200-period EMAs/SMA clusters. MACD and Momentum indicators also favor continued upside.
🔴 RESISTANCE ZONES
22,248.00 — 🔴 SELL STOPLOSS | Final Pivot High
21,955.77 — 🔴 SELL ORDER 2
21,364.19 — 🔴 SELL ORDER 1
🎯 TARGETS & BUY ORDERS
21,065.42 — 🎯 TP4 | EXIT THE RALLY
19,989.54 — 🎯 TP3 | Momentum confirmation
19,291.55 — 🎯 TP2 | Mid Pivot Zone
18,286.55 — 🎯 TP1 | Initial Profit Target
17,258.99 — ✅ BUY ORDER 1
16,630.74 — ✅ BUY ORDER 2
16,335.10 — ✅ BUY STOPLOSS | Pivot Low
🟢 SUPPORT STRUCTURE
PIVOT LOW @ 18,286 — Support holding for now
PIVOT LOW @ 17,258 — Strong confluence with previous structure
BUY ORDER zones between 16,330 – 17,258 — Demand cluster for reversals
🤓 STRUCTURAL NOTES
MACD shows bullish divergence with a rising histogram and crossover confirmation Momentum (+694) and RSI (66.69) suggest strength, though nearing overbought territory Price has reclaimed 10, 20, 50, 100, and 200 MA levels — rare alignment of major trend confirmation
Only outlier: Hull MA (9) signaling short-term overextension — may suggest brief consolidation before continuation
🌍 GLOBAL TECHNICAL SUMMARY
📊 12 of 13 Major Moving Averages = BUY
📈 MACD & Momentum Oscillators = BUY
🧭 Majority of Oscillators = Neutral — supporting a “calm before breakout” thesis ⚖️ CCI shows slight overbought = caution near resistance zones
📉 No major bearish divergence detected — trend remains intact
TRADE OUTLOOK 🔎
📈 Bullish Bias above 18,286.55 (TP1) targeting 19,291.55 (TP2) and beyond
📉 Bearish rejection likely near 21,065+ if volume fades — monitor RSI/MACD
👀 Watch for volume confirmation as we approach 19,989.55
🧪 STRATEGY RECOMMENDATION
CONSERVATIVE BREAKOUT ENTRY:
— Entry: 18,286.55
— TP Levels: 19,291.55 / 19,989.55 / 21,065.42
— SL: Below 17,258.99
RISK-ON DIP BUY STRATEGY:
— Buy Zone: 16,630 – 17,258
— TP: 18,286.55 / 19,291.55
— SL: Below 16,335.10
“Discipline | Consistency | PAY-tience”
US100 trade ideas

Looks Like a Good Short Term Sell To Me - NDXGood Morning,
We have some double rejection on NDX. Forming a nice consolidation pattern for a break above or below. I am in SQQQ until target zone.
Enjoy!

TECH STOCKS ON SCHEDULE TO RALLYWith the Tariff shocks well behind us, tech companies are looking extremely cheap at current prices. Price sustaining a close above 16,994.8 further confirms this

X2: NQ/US100/NAS100 Short - Day Trades 1:2 RRX2:
Risking 1% to make 2%
NAS100, US100, NQ, NASDAQ short for day trade, with my back testing of this strategy, it hits multiple possible take profits, manage your position accordingly.
Risking 1% to make 2%
Use proper risk management
Looks like good trade.
Lets monitor.
Use proper risk management.
Disclaimer: only idea, not advice

Quick technical piece on Nasdaq100From the technical side, we are near the short-term downside resistance line, which if broken, may open the door towards higher areas. But will it be enough?
Let's take a look.
MARKETSCOM:US100
Let us know what you think in the comments below.
Thank you.
77.3% of retail investor accounts lose money when trading CFDs with this provider. You should consider whether you understand how CFDs work and whether you can afford to take the high risk of losing your money. Past performance is not necessarily indicative of future results. The value of investments may fall as well as rise and the investor may not get back the amount initially invested. This content is not intended for nor applicable to residents of the UK. Cryptocurrency CFDs and spread bets are restricted in the UK for all retail clients.

Correction and Before a Push The US 100 shows an ascending triangle pattern that has not yet reached its projected high.
Context of the Ascending Triangle:
The price has formed an ascending triangle with an ascending support line (lower blue line) from point 1 to point 2.
Horizontal resistance is at 18,842.3 (point 3), and the price has not broken this level in a sustained manner or reached 18,979.0, as incorrectly indicated earlier.
Currently, the price is at 18,861.3, but for this scenario, we will assume it is retracing from a level close to resistance without having reached 18,979.0.
Correction to 18,670:
The price could retrace toward the key support at 18,671.7 (near point 2), which coincides with the triangle's ascending trend line.
This level has previously been solid support, making it a likely point for a rebound.
Rebound to 18,980:
From 18,670, the price could initiate an upward movement toward 18,980, a level projected as a target after breaking the triangle's resistance at 18,842.3.
This target is calculated by measuring the height of the triangle and projecting it from the breakout point.
Volume:
Volume shows a peak in previous upward movements, but has decreased in the current pullback, which is typical in a correction.
An increase in volume near 18,670 could confirm the entry of buyers for the rebound.
Trading Strategy:
Entry: Buy at 18,670 after confirming a rebound (e.g., a bullish candle with increasing volume).
Stop Loss: Place a stop loss below 18,600 to protect against a bearish breakout.
Take Profit: Target 18,980.
Risk: If the price falls below 18,600, the bullish scenario could be invalidated, targeting lower levels such as 18,500.
TradingView Idea:
US 100 (15M) - Correction to 18,670 before rising to 18,980.
Direction: Bullish after correction.
Entry: 18,670 (after confirming a rebound).
Stop Loss: 18,600.
Take Profit: 18,980.
Risk/Reward Ratio: Approximately 3:1.

NSDQ100 INTRADAY resistance retest U.S. futures rose and the dollar strengthened after Donald Trump eased concerns that had been weighing on markets. He stated he has no plans to fire Fed Chair Jerome Powell, despite ongoing frustrations over interest rates. While this helped calm nerves, Bloomberg's John Authers cautions against viewing it as a major shift in sentiment.
Trump also struck a more conciliatory tone on China, saying he intends to be “very nice” in trade talks and suggested tariffs could be lowered if a deal is reached—indicating a possible softening of his approach toward Beijing.
Key Support and Resistance Levels
Resistance Level 1: 19195
Resistance Level 2: 19600
Resistance Level 3: 20080
Support Level 1: 17820
Support Level 2: 17330
Support Level 3: 16700
This communication is for informational purposes only and should not be viewed as any form of recommendation as to a particular course of action or as investment advice. It is not intended as an offer or solicitation for the purchase or sale of any financial instrument or as an official confirmation of any transaction. Opinions, estimates and assumptions expressed herein are made as of the date of this communication and are subject to change without notice. This communication has been prepared based upon information, including market prices, data and other information, believed to be reliable; however, Trade Nation does not warrant its completeness or accuracy. All market prices and market data contained in or attached to this communication are indicative and subject to change without notice.

NQ: On its way to complete Wave 2NQ has completed both Initial and retrace swings of wave 2 and now NQ is in its way to complete the Impulsive swing.
We got a breakout and retest of the upper TL and price is moving up.
We have Manufacturing and Services data in a few.
1- Inline data: A shy retrace and continuation up/
2- Undershoot: Price might retest again the upper TL.
3- Overshoot: Direct move up.

CRT CREATEDThis week was a sweep and continue bullish, this was after the market draw on liquidity to send it off upwards. so expectation is the high will be taken out this week or next week if Thursday doesn't fulfil the wish. Monday was the low of the week during New York session causing Tuesday to follow the trend and break Monday's high

NAS100USD: Will Price Fill the Gap?Greetings Traders!
In today’s analysis of NAS100USD, we observe that the market is currently operating within a broader bullish institutional order flow. However, recent price action has left behind an inefficiency—a gap that may serve as a short-term draw on liquidity.
KEY OBSERVATIONS:
1. Gap in Price – Inefficiency Identified:
Price has created an imbalance that is yet to be filled. Typically, such inefficiencies act as magnets for price, drawing it back before resuming its primary trend. In this case, the gap may be partially filled as the market seeks equilibrium.
2. Draw on Liquidity – Last Point of Efficiency:
The last point of efficiency below current price levels may serve as the draw on liquidity. This level could attract price action as institutions look to rebalance orders and facilitate continuation.
3. Active Order Block – Potential Entry Zone:
Price is currently testing a bearish order block. Upon confirmation, this area may offer a short-term selling opportunity with the objective of targeting the liquidity pool and the inefficiency below.
TRADING PLAN:
Entry Consideration:
Look for bearish confirmation within the current order block zone before entering. The goal is to trade the short-term retracement within a bullish environment.
Profit Targets:
Target the liquidity pool and the unfilled gap near the last point of efficiency as short-term objectives.
Remain diligent, patient, and aligned with your trading plan. Always conduct your own analysis to ensure any setup is in harmony with your strategy and risk tolerance.
Kind Regards,
The Architect

NAS100 | 1H | BUY ZONEHey There;
SIGNAL ALERT
BUY NAS100 / 17,682,18
🟢TP1: 18,000,00
🟢TP2: 18,500,00
🟢TP3: 19,726,64
🔴SL: 16,782,61
RR / 2,2
Please don't forget to like 🙏🏻
Thanks to everyone who supports my analysis with likes. 💙💙💙

Nasdaq market analysis: 23-APRIL-2025Good morning Dear Traders! Join me for Nasdaq market analysis for today. Share your charts, ask questions, and let's discuss trading strategies.

Bullish Breakout on NAS100 – Momentum ShiftingNASDAQ 100 (US100) – Bullish Setup Developing
1. Falling Wedge Breakout:
Price has broken out of the falling wedge (purple trendlines), signaling a potential reversal to the upside.
2. Retesting Breakout Zone:
Current price action is retesting the breakout level near the 18,000 zone, indicating potential support forming.
3. Trendline Confluence:
The breakout aligns with the lower boundary of the broader ascending channel (blue), acting as dynamic support.
4. Strong Bullish Rejection at Lows:
Price showed strong buying interest near 17,700, forming a bullish rejection wick and bounce.
5. Clean Target Ahead:
Next key resistance zone lies around 18,540, where price may face selling pressure again – this matches previous structure and descending channel resistance.
6.Momentum Shift Noted:
Lower highs and lower lows structure has been invalidated, hinting at a possible trend shift.
Thanks for your Time..

Are we out of the woods yet ? From the day chart, it is 50/50 chance as we are in a crucial position.
While we are officially no longer in a bear market, the price action are still weak and has yet to break above the resistance of 19,213 on 9th April which was the day Trump announced a 90 days cooling period.
If the price action over the next week/month continues nicely in the upward channel, then the probability of breaking above 19,213 resistance is more secured.
The challenge remains nobody knows for sure what trump cards does Trump holds and he is well aware his words alone can moves the market. He said he is unhappy with Powell and that causes market jittery, another fall day and the next day, he said he has no intention of firing him.
And we have Bessent saying the de-escalation with China is coming to a close (really?) and that drives the market higher.
I bet it is very tough to be in Trump's team , facing so much pressure and stress and saying things out of proportions on a daily basis. Credibility is definitely at stake, just like a shattered mirror, the cracks will forever be there.
IF you feel extremely uncomfortable and you have positions in the US markets, perhaps trimming some of your holdings might help you to sleep better. Avoid taking on unnecessary risks by betting on short term market moves. The hardest part of trading is psychology and if you got lucky once or twice winning your bets, are you going to stop and not continue ? Or will you bet bigger? 90% of the traders will do the latter thinking they got things under control and that is when the market takes an abrupt turn and kill you without batting an eyelid.
Stay safe, stay wise, always have stop loss if you want to trade, never borrow money no matter how reliable you think your tips/indicators are telling you.

Buy Nasdaq - Candle stick CONFIRMED BUYERS are in control....
- broke through our STRONG RESISTANCE... bearish trend....
Buys Nasdaq.

FOR SCAPLER THATS A SHORT USTECHThemakert is showing a rejection on that trendline so wait in 1 Hour if that candlestic closes a revesal candlestic GO Short to cover The Gap

WHERE TO GO....NDXGood Morning,
I entered a trade with QQQ yesterday as the market has signaled a strong movement for the bulls. By no means is this a confirmed moved however I saw an opportunity for early entry.
We still need to beat out the overall trend reversal resistance which is at the 19,700 mark of April 2th.
Prior to that we need to make it through:
18,400$ First resistance.
19,000 2nd Resistance.
Trend is showing that we will break both of those levels.
Enjoy!

X2: NQ/US100/NAS100 Short - Day Trades 1:2 RRX2:
Risking 1% to make 2%
NAS100, US100, NQ, NASDAQ short for day trade, with my back testing of this strategy, it hits multiple possible take profits, manage your position accordingly.
Risking 1% to make 2%
Use proper risk management
Looks like good trade.
Lets monitor.
Use proper risk management.
Disclaimer: only idea, not advice

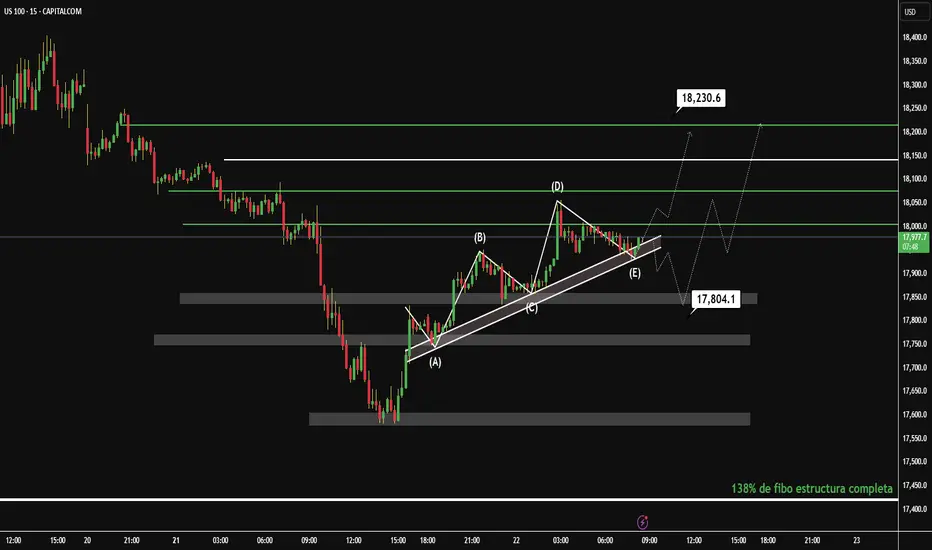
Ready for Takeoff: Buy Signal DetectedThe 15-minute chart of the NASDAQ shows a recent bullish move following a correction. I identify an interesting technical structure that could indicate an upcoming directional move.
Technical Analysis:
Patterns and Structure:
Symmetrical Triangle (A): The price has formed a symmetrical triangle between points (B) and (D), suggesting consolidation before a breakout. This pattern is neutral, but the recent upside breakout indicates a possible bullish continuation.
Fibonacci: The retracement from the high at (D) to the low at (E) reached the 38.2% Fibonacci level, which acted as dynamic support (17,804.1). This level is key and reinforces the validity of the current rebound.
Support and Resistance:
Support: The 17,804.1 level (38.2% Fibonacci) and the triangle base at 17,797.2 are key supports.
Resistance: The next upside target is at 18,230.6, a previous resistance level. If the price breaks above it, it could target 18,400.
Trend:
The breakout of the symmetrical triangle and the rebound from the 38.2% Fib confirm a short-term uptrend. The price is breaking the triangle's downtrend line (E), reinforcing the bullish momentum.
Trading Idea:
Entry: Consider a long entry (buy) at the current level (~18,000) or wait for a pullback to the support at 17,804.1 for a better risk-reward ratio.
Target: First target at 18,230.6 (resistance). If the momentum continues, the next level to watch is 18,400.
Stop Loss: Below the support at 17,797.2, to protect against a false breakout.
Risk/Reward: An entry at 18,000 with a stop at 17,797 and a target at 18,230 offers an R/B ratio of approximately 1:1.2.
Conclusion:
The NASDAQ at 15M shows a bullish breakout following a symmetrical triangle, with support at the 38.2% Fibonacci level. The short-term trend is bullish, with an initial target at 18,230.6. Monitor support at 17,804.1 to confirm the continuation of the move.
This analysis is concise and structured for a TradingView post. If you need adjustments or more details, please let me know.
Disclaimer: Grok is not a financial advisor; please consult one. Do not share information that could identify you.
ANALYSE NASDAK US 100now nasdak to way to finish first wave forentre now we need corection nasdak now more 8300 point like and follow our profile for more analyse forex crypto stocks future any help just inbox me our write comment and good luck

Hanzo | Nas100 15 min Breaks – Will Confirm the Next Move🆚 Nas100 – Hanzo’s Strike Setup
🔥 Timeframe: 15-Minute (15M)
———————
💯 Main Focus: Bullish Breakout at 18030
We are watching this zone closely.
📌 If price breaks with high volume, it confirms Smart Money is in control, and a strong move may follow.
💯 Main Focus: Bearish Breakout at 17830
We are watching this zone closely.
📌 If price breaks with high volume, it confirms Smart Money is in control, and a strong move may follow.
———
🔻 Every warrior needs a tribe.
Follow Hanzo. Support the path.
Analysis
👌 Bearish Signs (15M TF):
• Liquidity Grab + CHoCH at 18700
• Liquidity Grab + CHoCH at 18400
• Strong Rejections seen at:
➗ 18400 – Major support
➗ 19000 – Proven resistance
———
🩸 Key Zones to Watch:
• 18700 – Bearish breakout level
• 19130 – Strong resistance (tested 6 times)
• 18400 – Equal lows
Hanzo | Nas100 15 min Breaks – Will Confirm the Next Move

NAS100USD: Bearish Bias Expected to Hold After RetracementGreetings Traders!
In today’s analysis of NAS100USD, we maintain a bearish outlook despite short-term bullish movements in price action. These bullish signs appear to be corrective and in alignment with institutional objectives to rebalance inefficiencies created during yesterday’s sharp decline.
KEY OBSERVATIONS:
1. Inefficiency Rebalancing Completed:
Price has retraced to fill fair value gaps left behind by recent downside volatility. With those inefficiencies now rebalanced, we anticipate a continuation of the dominant bearish institutional order flow.
2. Buy Stops Taken – Institutional Order Pairing:
The sweep of buy stops confirms liquidity collection for institutional sell-side positioning. This aligns with a classic distribution phase, where institutions utilize buy-side liquidity to enter short positions.
3. Institutional Resistance – Rejection Block:
Price is currently reacting at a key institutional resistance zone, known as the rejection block. This zone, formed prior to the latest downside move, may act as the final area of resistance before renewed bearish continuation.
TRADING PLAN:
Entry Consideration:
Monitor price behavior at the rejection block. Upon confirmation, this area offers a high-probability setup for short entries.
Profit Targets:
Focus on targeting liquidity pools resting at deeper discount levels. These areas represent logical destinations for price based on institutional order flow dynamics.
Remain diligent and patient in your execution. Let the market confirm the direction before committing to a position.
Kind Regards,
The Architect

Nasdaq 100 (US100) – Bearish Double Top PatternNasdaq 100 shows a clear Double Top pattern, signaling a potential bearish reversal after recent bullish momentum. Price has broken below the neckline, confirming the pattern, and is now heading toward the projected target around 16,500.
Fundamentally, risk sentiment remains shaky amid rising interest rate expectations and mixed earnings reports, adding pressure to tech-heavy indices like US100.
Pattern: Double Top
Bias: Bearish
Target: 16,500
Resistance: 18,000+
Trade Active: Short bias below neckline level
NOTE: This is not financial advice. Trade at your own risk.
Support: Like & follow for more trade ideas!
