Technical Breakdown on US 100 | 1H TimeframeTechnical Breakdown on US100 1H Chart using Volume Profile, Gann, and CVD + ADX
1. Key Observations (Volume, Gann & CVD + ADX Focused)
a) Volume Profile Insights:
Value Area High (VAH): 20,035 (approx. from most recent high-volume node)
Value Area Low (VAL): 19,710
Point of Control (POC):
High-Volume Nodes: Clustered between 19,850 – 20,050 (heavy volume activity)
Low-Volume Gaps: Between 19,700 – 19,800 (could act as fast move zones)
b) Liquidity Zones:
Liquidity Pools:
Order Absorption: Observed near 19,850 (buy side absorption with wicks and CVD reaction)
c) Volume-Based Swing Highs/Lows:
Swing High: 20,035 with volume tapering and price exhaustion
Swing Low: 19,710 showing high delta rebound and large wick
d) CVD + ADX Indicator Analysis:
Trend Direction: Uptrend (price making HH/HL, supported by rising channel)
ADX Strength: ADX > 20, DI+ > DI- → Confirmed bullish trend
CVD Confirmation:
2. Support & Resistance Levels
a) Volume-Based Levels:
Support:
Resistance:
b) Gann-Based Levels:
Recent Swing Low: 19,710 (1/3 retracement zone)
Key Retracement Levels:
3. Chart Patterns & Market Structure
a) Trend: Bullish (confirmed by ADX > 20 and CVD rising)
b) Notable Patterns:
Bullish Ascending Channel clearly forming with higher lows
Price pulled back to mid-channel + POC confluence, showing signs of retest and continuation
No major bearish reversal patterns yet; healthy pullback structure
4. Trade Setup & Risk Management
a) Bullish Entry (CVD + ADX confirm uptrend):
Entry Zone: 19,850–19,875 (POC retest + trendline support)
Targets:
Stop-Loss (SL): 19,700 (below VAL and swing low)
RR: ~1:2.5
b) Bearish Entry (Only on breakdown):
Entry Zone: Below 19,700 (VAL loss + CVD breakdown)
Target: T1: 19,422.18 (previous POC support)
Stop-Loss (SL): 19,860 (back above trendline/POC)
RR: ~1:2
c) Position Sizing:
Risk only 1-2% of capital per trade for controlled exposure
US100 trade ideas

Nas100 Buy Looking at the w1 chart we can spot out a strong pullback momentum which gave D1 TF a bullish bias and now on h4 price look to pullback towards an AOI for a bullish continuation. Fingers crossed

NASDAQ SELL?This is just a rough idea, I still need to wait and see where the market moves to and rejects from in order for TP and SL placement.
But, there is a Asian high, a London high and a NY high sitting closely together, causing what I call a liquidity pool, and we all know that liquidity moves the market. its like a magnet for the market.
so I'll be waiting and watching to see which session is swept and how the market reacts. But all in all, this is what i personally think Nasdaq will do
what are your thoughts? I would love to hear them.
I hope you all have a fantastic week and you rake in those profits.
God bless
J.D.L

NQ: Upcoming Weekly Analysis!FA Analysis:
1- Macro economic Indicators: Most data came red and few were inline confirming the slowing down of the economy.
2- Inflation data came better than expected.
3- Trump Tariffs: Strong rumors about deals underway from this week. The 90-day pause will become an indeterminate pause.
4- We have the FED this week. Nothing in terms of immediate rate cut, but the conference is very important for the looking forward.
5-ISM Services data is important.
From FA perspective, market is focusing on Tariffs deals. If it materializes, the ST outlook will change from Sell to Buy. MT and LT Outlook will stay Sell.
TA Analysis:
Weekly TF:
The weekly close was bullish and price retraced more than 61.8. This could be the end of this wave.
The FED and/or the tariff deals will give the signal for either the start of wave 3 or a continuation up. Until then, a consolidation is expected.
Daily TF:
Same as weekly... a bullish daily close. A consolidation is expected until the FED.
Happy and green week to Everyone!

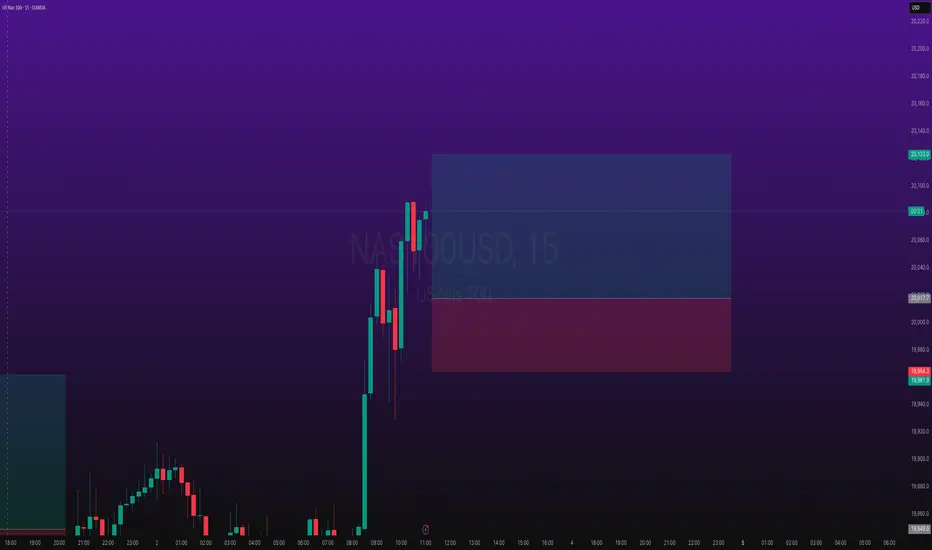
US100 BEST PLACE TO SELL FROM|SHORT
US100 SIGNAL
Trade Direction: short
Entry Level: 20,101.6
Target Level: 18,779.9
Stop Loss: 20,975.6
RISK PROFILE
Risk level: medium
Suggested risk: 1%
Timeframe: 12h
Disclosure: I am part of Trade Nation's Influencer program and receive a monthly fee for using their TradingView charts in my analysis.
✅LIKE AND COMMENT MY IDEAS✅

NAS100 1WTake a look at this chart! After a solid uptrend, the price broke an important ascending trendline and corrected down to the 0.5 Fibonacci level — right where a key structural support zone is (that blue area near the bottom).
From there, we’ve seen a strong bounce back upward, and now the price has reached a critical zone:
Previous resistance
The 0.618 to 0.786 Fibonacci retracement area
And most importantly, a retest (pullback) to the broken trendline
There are two possible scenarios ahead:
1. If the price breaks and holds above this resistance zone, we might see the continuation of the bullish move.
2. But if it fails to break through, the market could enter another corrective phase.
Also, keep in mind that we have the interest rate decision this week. With Trump applying repeated pressure, there’s a chance rates might be cut — which could fuel a green, bullish market.

X2: NQ/US100/NAS100 Long - Day Trades 1:2X2:
Risking 1% to make 2%
NAS100, US100, NQ, NASDAQ Long for day trade, with my back testing of this strategy, it hits multiple possible take profits, manage your position accordingly.
Risking 1% to make 2%
Use proper risk management
Looks like good trade.
Lets monitor.
Use proper risk management.
Disclaimer: only idea, not advice
Nasdaq LongsShould price retrace to that IFVG level, I will look for a sell side liquidity sweep and go long.

NASDAQ Sell idea🔸 Resistance Strong supply zone around 19,419.5–19,430 (previous high & breakout failure)
🔸 Bearish Structure If price fails to break and hold above 19,430, double top or lower high forms
🔸 Wick Rejection Multiple upper wicks near resistance could signal rejection and exhaustion
🔸 Volume Behavior Potential volume spike without follow-through → trap buyers
🔸 Momentum Divergence If momentum slows on retest of high, weakening bullish pressure


X2: NQ/US100/NAS100 Long - Day Trades 1:2X2:
Risking 1% to make 2%
NAS100, US100, NQ, NASDAQ Long for day trade, with my back testing of this strategy, it hits multiple possible take profits, manage your position accordingly.
Risking 1% to make 2%
Use proper risk management
Looks like good trade.
Lets monitor.
Use proper risk management.
Disclaimer: only idea, not advice

LONG IDEA LASCENDING CHANNEL BREAKOUT NAS100?Looking for a breakout of this upward channel, price above EMA, targeting 27.20 fib level or most recent high before downward trend began.
Opinions?

anyone that is buying is missing outgreat discounts I guess sir Warren Buffet is to buy now? still this good discounts are for everyone to buy.

FOMO hurtsH1 pushed high enough from a FVG
Structure got broke giving another oppertunity to get in
Resting above we got a clear FVG on the Daily tf thats need to be filled
Well lets see What NFP brings to the table
Be safe out there🫡🫡

Is Nasdaq still bullish? Steep correction today as expectedIf you look at my last post, you can see where I explained the expectation.
As range theory would state, the rejection from the bottom of a range creates a target in the high of the range. I have identified the candle top that I believe is the target for this rally.
If the bearish imbalance is stacked with too many orders we will not make it there. We are sitting right around the 50EMA for hourly as well as retesting the break point and bottom of the hourly bearish orderblock as I have marked.
It is in my opinion that the Void will act as a magnetic anomaly and assist in pulling price up as many institutional orders will be in that range, but we'll see 🔑
Share with a friend in need of real guidance 🫡

Finally a correction in indices collective imbalance belowBeen wanting to show you all the mechanics of the correction phase when it happened. A very good formation here, feast your eyes. EASY 🔓


NASDAQ a look ahead...As the NASDAQ and other major U.S. Equity Indexes face the pressure of economic uncertainty, the price action between days show that investors are not quite convinced this bull run has seen its finish line. However, we shouldn't only be looking toward private investor sentiment, but also that of the Federal Reserve's presence in the market and how the bond market reflects the Fed's position moving forward.
As shown here, the all time high for the TVC:NDQ is $22,133.22. Our position is that the NASDAQ must reclaim, retest, and continue beyond the all time high in order for us to continue our confirmation on the bull run. The path described should look as shown below...
In this instance, we can assume the bull run should continue. However, we should also be prepared for an alternate scenario where investors leave risk assets behind to chase non-risk assets (bonds for example). This scenario would look as shown below.
All though these are not the only two possible scenarios, we can most likely expect the future to play out in a similar fashion as the examples.
As for the market metrics to keep an eye on, look to TVC:US10Y for any bond yield manipulation, FRED:RRPONTSYD for market liquidity metrics, and FRED:M1V for M1 money velocity. Furthermore, keep an eye on tariffs for consumer tech ( NASDAQ:AAPL , NASDAQ:NVDA , NYSE:TSM ) and military activity ( NYSE:LMT , NYSE:RTX , NYSE:NOC ). Lastly, keep an eye on the banking and financial sector for more than likely banking deregulations withing the coming years.

nas100nas100 went for 484 pips off the bearish action i took an caught 325 pips after the price action close

NAS100 SELL 1 HOUR TIME FRAMESTRONG SUPPLY ZONE
Fair value gaps to fill
Amazing Range 2:41 Risk Reward, Let's See!

NAS 100 EYESThis is where our eyes currently are, there is a clear gap that the low energy movement is heading toward, challenging a weekly low, with a 4 hour unconfirmed bullish trend. We hope to see more unfold today, Happy Trading. Hit me Up.

US100 H4 | Bearish Fall Based on the H1 chart analysis, we can see that the price has just reacted off our sell entry at 19,514.93, which is ana swing high resistance.
Our take profit will be at 19363.72, a pullback support.
The stop loss will be placed at 19,637.23, above the 127.2% Fibo extension.
High Risk Investment Warning
Trading Forex/CFDs on margin carries a high level of risk and may not be suitable for all investors. Leverage can work against you.
Stratos Markets Limited (tradu.com):
CFDs are complex instruments and come with a high risk of losing money rapidly due to leverage. 63% of retail investor accounts lose money when trading CFDs with this provider. You should consider whether you understand how CFDs work and whether you can afford to take the high risk of losing your money.
Stratos Europe Ltd (tradu.com):
CFDs are complex instruments and come with a high risk of losing money rapidly due to leverage. 63% of retail investor accounts lose money when trading CFDs with this provider. You should consider whether you understand how CFDs work and whether you can afford to take the high risk of losing your money.
Stratos Global LLC (tradu.com):
Losses can exceed deposits.
Please be advised that the information presented on TradingView is provided to Tradu (‘Company’, ‘we’) by a third-party provider (‘TFA Global Pte Ltd’). Please be reminded that you are solely responsible for the trading decisions on your account. There is a very high degree of risk involved in trading. Any information and/or content is intended entirely for research, educational and informational purposes only and does not constitute investment or consultation advice or investment strategy. The information is not tailored to the investment needs of any specific person and therefore does not involve a consideration of any of the investment objectives, financial situation or needs of any viewer that may receive it. Kindly also note that past performance is not a reliable indicator of future results. Actual results may differ materially from those anticipated in forward-looking or past performance statements. We assume no liability as to the accuracy or completeness of any of the information and/or content provided herein and the Company cannot be held responsible for any omission, mistake nor for any loss or damage including without limitation to any loss of profit which may arise from reliance on any information supplied by TFA Global Pte Ltd.
The speaker(s) is neither an employee, agent nor representative of Tradu and is therefore acting independently. The opinions given are their own, constitute general market commentary, and do not constitute the opinion or advice of Tradu or any form of personal or investment advice. Tradu neither endorses nor guarantees offerings of third-party speakers, nor is Tradu responsible for the content, veracity or opinions of third-party speakers, presenters or participants.

Lesson 10: Nas-Daq100 Wick trading analysisAnalyzing Nas 100 trading strategy using wicks as a point of entry.
