MATICBTC trade ideas


MATIC \ BTC. Profit 166.66%. Cyclicity and trend.The cyclical process was not ignored by Russian scientists. For example, N.D. Kondratyev at about the same time period revealed a pattern of fluctuations in production and prices every 50-60 years.
This cyclicity is called Kondratiev waves or K-waves.
Cyclicity in a more or less stable form is present in commodity markets, as can be seen in Fig. 26, where you can see an example of a cyclical trend in wheat price changes (2010-2012).
But since we are on the cryptocurrency market, everything happens faster and with less periodicity
1) Ovals - repeating channels after the pumps
2) Arrows - repetition of an occurring formation
Good luck to everyone

Matic Bull Swingbreaking resistance on 220 sats is the first mission for matic before moving on to higher levels again. First target 230 sats and distination to 300 sats


It is good time to buy MATICHello guys. This my first analysis.
A stochastic oscillator is a momentum indicator comparing a particular closing price of a security to a range of its prices over a certain period of time. It can show various things such as oversold and overbought. According to daily candle graphic stochastic indicator shows it is oversold. So we can expect that MATIC/BTC will rise up. Moreover weekly stochastic oscillator increasing so we can expect at least a few week increase in MATIC.
On the other hand Fibionacci retracement indicator clearly shows that it is strong support on 217 satoshi. If the price closes over this level (it seems it will) 217 satoshi will be new support. And 250 satoshi will be new resistance. Let's wait and see what will happen.
Thank you for reading. And i am waiting your comments.

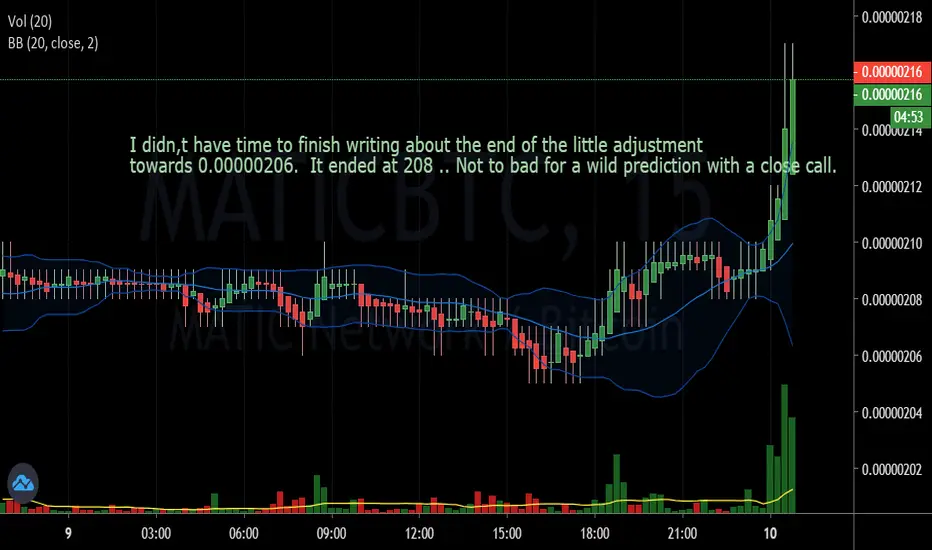
A close call.I did not have time to finish writing about the end of the little adjustment
towards 0.00000206. It ended at 208 .. Not to bad for a wild prediction with a close call.
Matic oh Matic NetworkIt looks more like a price going down towards 0.00000206 than going anywhere else. Sorry....

Matic Big Move next few hours Matic has desending triangle, Might breakout or breakdown. Its could go to 175 or 237
Dont forget to but a stoploss :) and rebuy at 175 if its beaks down


MATIC SPOT THE PATTERN She tends to bounce off the 50 day MA. Im taking this trade with a loose stop, worth it imo.


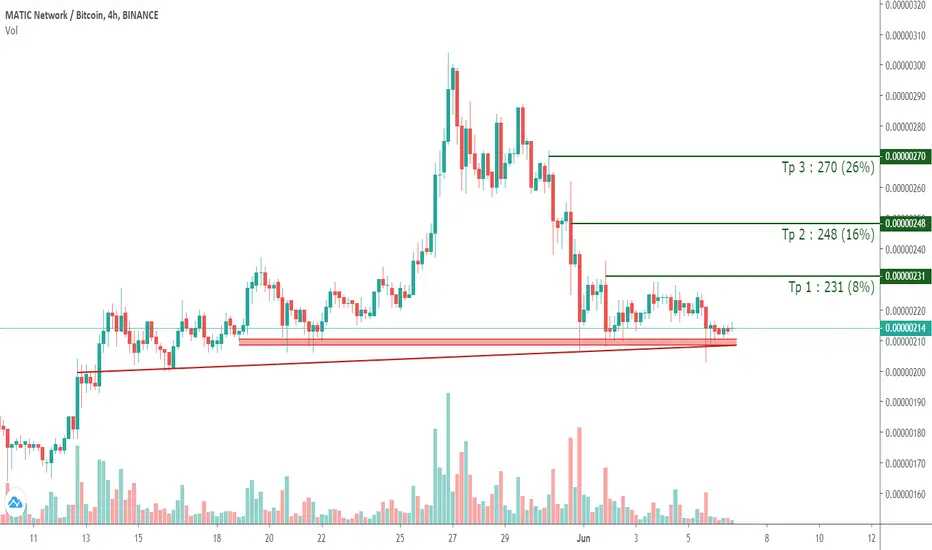
Testing Support Zone ,Ready To Jump📡 MATIC / BTC
🌐 Exchange : BINANCE
▶️ Buy : 214
👇 Targets :
✅ Tp 1 : 231 (8%)
✅ Tp 2 : 248 (16%)
✅ Tp 3 : 270 (26%)
🔴 Stop loss zone : 195 ~ 193
Deep down after a Breakout! can repeat...after its breakout days ago, now its so down, i think its about to repeat again.
i bought at 218! lol
hope to get lucky
stop 199
t1 ~ 240
t2 ~ 260
fomo t3 280+


MATICBTC possible trading planDAILY:
-MACD had a bearish cross
-RSI is about to challenge an important trendline and is important o see reaction to understand direction
-10DMA preparing to cross down 20DMA ( bearish)
-checking if price manages to flip 200DMA from resistance to support
-VOLUME is very low which is bearish
There is no upcoming event to support a run up.
Tools
EMA's 8/13/21/55 (scalp)
MA's 10/20/50/100/200 (swing trade)
RSI , MACD , VOLUME , FIBONACCI,DIVERGENCE
STANDARD PIVOTS , CANDLES, TRENDLINES


MATIC: Excellent Short OpportunityMATIC is hitting a strong resistance again. The price could be pushed down.

LONG PositionHello dears
Two Strong support on MATICUSDT And MATICBTC exist.
however we can buy Matic with Good Risk to Reward Ratio
Push ❤️ if you think this is a useful idea!
Thanks for your support!!!

$MATIC : Possible Cat Ears Pattern; a small study.Possible Cat Ears pattern, note that i said possible.
A cat ears pattern is found after a downtrend and consists of two "ears" which you can see above. Its a downtrend continuation pattern but it has a HIGH FAILURE RATE which means you are probably better off looking for long setups on it.
A cat ears pattern has 6 variations, follow the link here and you can see for yourself on Thomas Bulkowskis website:
(Look at the picture with 6 variations, example #3)
www.thepatternsite.com
One variation is as follows:
-Downtrend
-Sideways trading
-Spike one (1st ear, higher)
-Sideways trading
-Spike two (2nd ear, lower)
We are in the middle of spike two, its currently trying to hold the 0.618 fib as support, BUT if this does not hold and we come down to the outlined breakout level then we can see a rejection or breakout of the car ears pattern.
So we watch, if it comes down to the bottom breakout level, it can fakeout below the support then close above, breaking the diagnol downtrend resistance line. Or the pattern plays out, but altcoins are looking quite good atm so i doubt that, Theres a chance we dont even come down to finish painting the 2nd ear and go from here.
This idea is pure theoritcal and im only posting it to backtrack on later to see if we complete the pattern and how it does play out.

MATIC/BTC Fibonacci Retracement Trade (LONG)#MATIC/BTC
Let’s make a Fibonacci trade here on Matic.
Buy-180-194-213
Sell- 220-234-248-270-300
SL- 175
Cheers

Matic Bullish Flag Pattern ( Target 310-320 ) 30% profit :)Buy Matic :) you wont regret ( and dont forget to do money management) “stoploss “
I putted it at 224
If you liked my the idea then leave a like :)!
