MATIC / USD Daily Chart Ascending Channel Im liking this chart. looks like it has some room to come down and touch the lower trend line and still be very healthy.
Im trying to make charts that work more as pictures and that can evolve overtime since some indicators do not carry over with the chart.
God Bless anyone reading this.
Habakkuk 2:2
King James Version
2 And the Lord answered me, and said, Write the vision, and make it plain upon tables, that he may run that readeth it.
MATICPERP trade ideas

Trading Smart MoneyTrading Smart Money, some cash and patience is all it takes (:
I have placed buy limits on support levels.
Smart money buys the dip to sell with big gains. It's all about PATIENCE, the market will recover, as always.
No leverage, no short's, just patience

Polygon Matic Bullish Continuation Pattern Lots of accumulation between $1.75-2.50 leads me to believe another wave is coming. Next major target resistance $5

$MATIC Time for Dip?4 Bounces off Upper Trendline,
5 Bounce off Lower Trendline
RSI around 65, indicating overbought region.
MACD levels are around the highs from previous bounces.
I can see this go to the $2 levels.
Please comment and let me know what you think.

i dont even knowI think it is going to drop because im guessing. But a lot of new things might pump.

Polygon: Booming!The Polygon price has dropped significantly and is doing well within the light blue zone. However, the drop should only continue until $1.664 at max. With a low around that mark, we expect the course to move upwards again and seek prices of above $4!
Almost there!

Long Matic up to $2.2Below 1.75 we are no longer Bullish but above $1.8 we expect the pattern of retracements then pumps to continue.

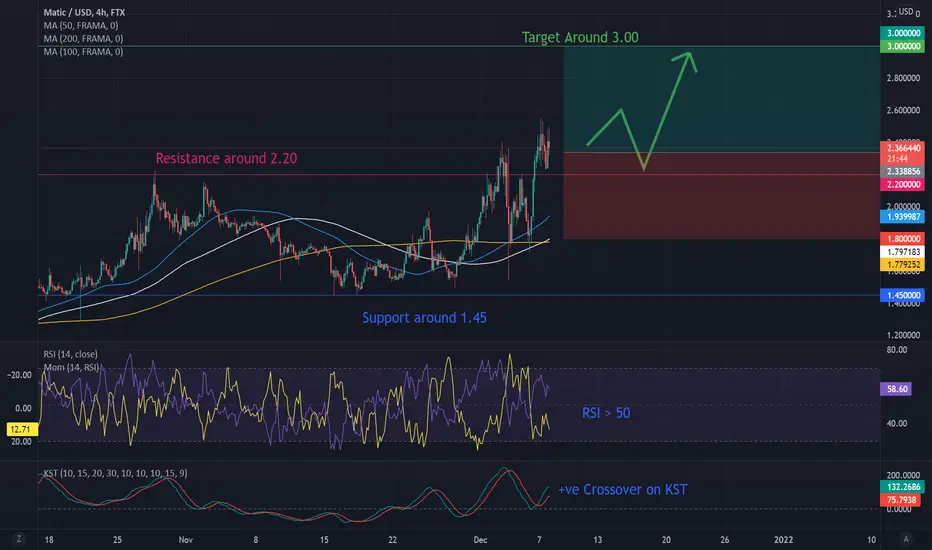
Potential Breakout in MATIC, Will Head Towards 3Trend Analysis
The main view of this trade idea is on the 4-Hour Chart. The cryptocurrency Polygon (MATIC) had been in a rangebound mode after hitting resistance around the 2.20 price level is late October 2021. The cryptocurrency found some support at the 1.45 price level where it made sharp moves higher over the last couple of weeks, testing and breaking above 2.20. Expectations are for MATIC to continue this move higher, with a target of 3. Failure of this projection will see MATIC trading around 1.80.
On the Daily Chart MATIC is in an upward trajectory, with some resistance around the 2.5 price level.
Technical Indicators
There has been recent crossovers on the short (50-MA), medium (100-MA) and long (200-MA) fractal moving averages. MATIC is currently trading above all 3, which is a bullish sign. The RSI is above 50 with the KST recently making a positive crossover.
Recommendation
The recommendation will be to go long at market, with a stop loss at 1.8 and a target of 3.0. This produces a risk/reward ratio of 1.23.
Disclaimer
The views expressed are mine and do not represent the views of my employers and business partners. Persons acting on these recommendations are doing so at their own risk. These recommendations are not a solicitation to buy or to sell but are for purely discussion purposes. At the time of publishing I have exposure to MATIC.
MATICWe shared some profitable MATIC setups over the last 3 weeks.
Now, MATIC is near a key diagonal support level (log scale) which has always acted as support since April 2022!
If this support fails, we might see MATIC coming to the next support zone between $1.5 and $1.6

MATIC - one of the few remaningETH, AVAX, SOL, etc. have fallen healthily below their bull market trend lines, and some have even back-checked them and rolled over.
The MATIC bull market looks different than these other players in that the bull market trendline (purple) is not at all a good guide for the price action in the time from then till now. It has, nonetheless be breached a few times now.
The long orange line is the best trendline to use, it is a price channel capturing most of the MATIC bull market minus the initial first parabolic rally. MATIC is still holding it for now.
MATIC is also not matching BTC's price action like the others, the general trends yes, but not the movement.
That said, the vacation is over if we drop below 1.60.

MATIC : UPDATEDEverything is on the chart .
I'm on MATICBEAR leverage token :) Looking forward to close it around 1.7-1.4
(and keep some for big bear smash)


MATIC/USDT long term viewMATIC/USDT is moving in parabolic direction while the fundamental is strong. The future is bright.


Matic still need a pullbackMatic is oversold on the 12H and needs a pullback. I am adding at 1.9 zone


simple analyse technique concernant MATIC la crypto monnaie matic est une crypto trés potentiale le graphique indique selon analyse technique que MATIC il a la posibilité d'augmenter avec le temps jusqu'a la prochain resistance.

Matic Long Term TargetKarnage's long term target for Polygon (MATIC) - has strong narrative in ZK rollups so could break resistance soon.

Most realistic path for MaticMatic seeing a nice methodical rise trading very technically which is very healthy, I would suspect we continue with that until we break through ATH then we can expand rather quickly, but unless we see bitcoin bounce back towards ATH i just don't think we see a crazy parabolic move like last time, but i've been long on this for quite some time and and that's not changing

MATICUSD wyckoff re-accumulationwyckoff re-accumulation COINBASE:MATICUSD MATICUSD BINANCEUS:MATICUSD

matic/usd Beautiful trend building upMatic has been following a trend with in the cannel pattern making it easier for us to know entries & exits.

MATICUSD LONGVolume on the faily chart has really picked up. All in support of the break of $2 and surge to ATH's.

Correction expected on MATICMATIC is still in uptrend channel but is expected to take a short term correction.
