Bullish Harami/ Hammer -Unconfirmed Candlestick PatternThis candlestick pattern lacks confirmation but suggest a bottom may be forming for crude oil. This is likely fully driven by the state of the economy and trade. Any positive news around the economy, geo politics, trade, etc. will likely result in confirmation with a bullish candle and prices could
Sorry, this is only available to registered users
MCX provides data to our registered users only, so to get it you'll need to sign up for a TradingView account.

MCX Crude Oil Hourly PredictionAs shown in the attached chart, MCX Crude Oil performed well under 1 hourly chart always.
Disclaimer:- All the shared views are for educational purposes only. We provide Technical Indicators only for educational purposes. As we are not SEBI registered, there will be no claim rights reserved. Pleas

OPEC at a turning point: what’s next for oil? All eyes are on OPEC ahead of its May 5 meeting as it faces pressure from falling prices, weak demand, and internal rifts.
While some expect a pause in output hikes, the consensus points to continued increases. The group’s decision will be key in shaping oil market dynamics amid trade tensions

Crude Oil (WTI) | Hidden Accumulation| (April 2025)Crude Oil (WTI) | Short Bias | Hidden Accumulation + Fib Target | (April 27, 2025)
1️⃣ Insight Summary:
Money flow is exiting Crude Oil on the 4-hour chart, but price is holding steady — showing signs of hidden accumulation. A big move could be setting up soon!
2️⃣ Trade Parameters:
Bias: Short
En

Crude oil------sell near 61.60, target 60.00-58.00Crude oil market analysis:
Crude oil has also started to fluctuate recently. Yesterday's daily line finally began to decline. Crude oil is bearish in both the big and small trends. Continue to sell when it rebounds to the moving average. The crude oil pattern is still weak on the daily line. The cur

WTI: Break It or Bounce ItIf other cyclical asset classes are rallying like a global recession can be avoided, then why shouldn’t crude oil? Yes, there are reports OPEC+ may increase output again, and we know Donald Trump wants lower prices, but those factors should already be priced in. The true swing factor is demand—and i

Oil Price Rebound UnravelsThe price of oil may continue to give back the rebound from the monthly low ($54.46) as it extends the decline from the start of the week.
The price of oil starts to carve a series of lower highs and lows as it snaps the range bound price action from last week, with a move/close below the $59.20 (7

Oil long term downOil
Monthly
Monthly continuation down
Psychological support level 50
Strong 43.5 level
Weekly
Expecting weekly continuation down
R/R high as price is really close to 55 last's month low level
Conclusion
Not a good trade setup
However long term is down maybe all the way to weekly or monthly RSI 30

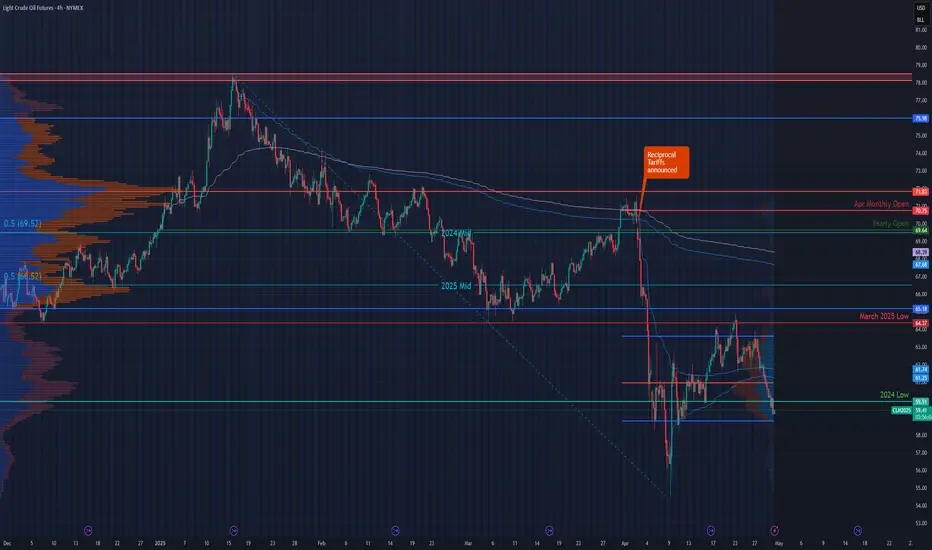
Planning for the Next Trade in Crude OilNYMEX:CL1!
Key Levels – Higher Timeframe:
• 2025 High: 78.56
• Yearly Open (2025): 69.64
• 2025 mCVPOC: 71.83
• Yearly VWAP: 68.41
• AVWAP from Yearly Highs: 67.71
• 2025 mCVAL: 65.28
• March 2025 Low: 64.37
• 2024 Low: 59.91
April 2025 Key Levels:
• April mCVAL: 58.79
• April mCVPOC: 60.94
#202518 - priceactiontds - weekly update - oilGood Evening and I hope you are well.
comment: Bears defended the breakout area and kept the market in a bear trend. Bulls tried to print a higher low with a decent bull reversal bar on Thursday. Now what? No idea. Oil below 60 is a big thing and staying below is somewhat low probability, given the

See all ideas
Summarizing what the indicators are suggesting.
Neutral
SellBuy
Strong sellStrong buy
Strong sellSellNeutralBuyStrong buy
Neutral
SellBuy
Strong sellStrong buy
Strong sellSellNeutralBuyStrong buy
Neutral
SellBuy
Strong sellStrong buy
Strong sellSellNeutralBuyStrong buy
A representation of what an asset is worth today and what the market thinks it will be worth in the future.
Sorry, this is only available to registered users
MCX provides data to our registered users only, so to get it you'll need to sign up for a TradingView account.
Displays a symbol's price movements over previous years to identify recurring trends.
Related commodities
Frequently Asked Questions
Open interest is the number of contracts held by traders in active positions — they're not closed or expired. For Crude Oil Mini Futures this number is 27.67 K. You can use it to track a prevailing market trend and adjust your own strategy: declining open interest for Crude Oil Mini Futures shows that traders are closing their positions, which means a weakening trend.
Buying or selling futures contracts depends on many factors: season, underlying commodity, your own trading strategy. So mostly it's up to you, but if you look for some certain calculations to take into account, you can study technical analysis for Crude Oil Mini Futures. Today its technical rating is sell, but remember that market conditions change all the time, so it's always crucial to do your own research. See more of Crude Oil Mini Futures technicals for a more comprehensive analysis.