MEME/USDT: BREAKOUT ALERT!!🚀 MEME Breakout Alert – 40%+ Potential Incoming?! 👀🔥
Hey Traders! If you're all about high-conviction plays and real alpha, smash that 👍 and tap Follow for more setups that actually deliver! 💹💯
🚀 AMEX:MEME / USDT Long Setup – Breakout Watch! 🚀
AMEX:MEME is squeezing inside a symmetrical trian

MEME/USDT Analysis — Symmetrical Triangle Breakout + Golden CrosMEME/USDT Analysis — Symmetrical Triangle Breakout + Golden Cross! 🚀
Timeframe: 4H
Exchange: Binance (Perpetual Contract)
Chart Type: Heikin Ashi
📊 Technical Analysis:
A Symmetrical Triangle formation is visible, suggesting a potential strong breakout.
Golden Cross observed: EMA 50 (yellow) is cro

MEMEUSDT:- Pennant Breakout coming up.BINANCE:MEMEUSDT - Breakout to the upside coming up in meme once it reaches the edge of the triangle. Expecting a huge upside. Keep watching the edge of the triangle in the days to come. Thank You!

MEME price analysis⁉️ Maybe #MEME is trying to start the memecoin 2.0 season?)
Before the strong resistance from above, the growth potential is 400%, but even this will not be much consolation for those who bought OKX:MEMEUSDT a year ago.
But again, in accordance with the assumption that was written a few posts ear

#MEME/USDT#MEME
The price is moving within a descending channel on the 1-hour frame, adhering well to it, and is on its way to breaking it strongly upwards and retesting it.
We are seeing a bounce from the lower boundary of the descending channel. This support is at 0.001424.
We have a downtrend on the RSI

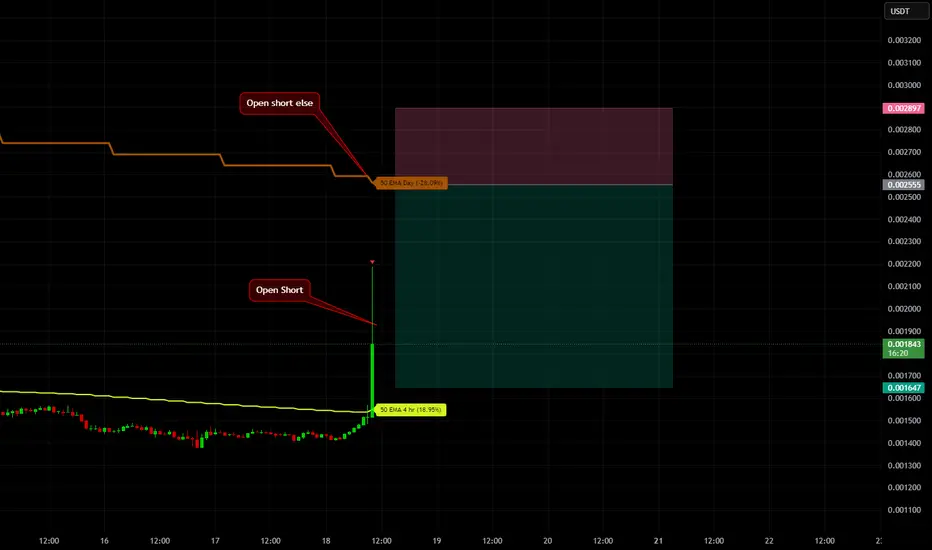
MEMEUSDT ShortMEMEUSDT had a strong breakout from the 4H EMA50 — up 23%! This setup is perfect for a short without a stop, using scaling in.
There’s a chance price might reach the daily EMA50 — if it does, I’ll add more to the short from there. The target will be adjusted based on how the 4H EMA50 moves.
Meme - Pump?I know a person who is has drowdown position in a 98 percent
Do you think there will be a Pump?

#memeA good opportunity for a very good drop. It will definitely go to the third target and even lower.

#MEME/USDT#MEME
The price is moving in a descending channel on the 1-hour frame and is adhering to it well and is heading to break it strongly upwards and retest it
We have a bounce from the lower limit of the descending channel, this support is at a price of 0.00284
We have a downtrend on the RSI indicato


See all ideas
Summarizing what the indicators are suggesting.
Oscillators
Neutral
SellBuy
Strong sellStrong buy
Strong sellSellNeutralBuyStrong buy
Oscillators
Neutral
SellBuy
Strong sellStrong buy
Strong sellSellNeutralBuyStrong buy
Summary
Neutral
SellBuy
Strong sellStrong buy
Strong sellSellNeutralBuyStrong buy
Summary
Neutral
SellBuy
Strong sellStrong buy
Strong sellSellNeutralBuyStrong buy
Summary
Neutral
SellBuy
Strong sellStrong buy
Strong sellSellNeutralBuyStrong buy
Moving Averages
Neutral
SellBuy
Strong sellStrong buy
Strong sellSellNeutralBuyStrong buy
Moving Averages
Neutral
SellBuy
Strong sellStrong buy
Strong sellSellNeutralBuyStrong buy
Displays a symbol's price movements over previous years to identify recurring trends.