MEW Sell/Short Setup (4H)We have a supply zone from which a strong drop has previously formed. This zone has been tested once already, but with only minimal penetration. Given this shallow penetration and the price’s inability to make a lower low, we are once again expecting a potential short position from this zone.
We’re

#MEWUSDT - Recovered after the sell-off, is the drop coming? Hey folks! 🚀
Today, we’re diving into the analysis of a highly volatile coin. Our special guest for the day: #MEWUSDT.P! 🔥
Looking at the #MEWUSDT chart, we saw a sharp pullback from $0.00300 after facing strong selling pressure, dropping all the way down to $0.0026. Right now, it's making a corre

cat in a dogs world #MEW price analysis🍿 Despite all the "trash" that has been happening on the crypto market lately and will continue at least today, someone decided to try their luck or has a clearly calculated plan!?)
1️⃣ Trading volumes of OKX:MEWUSDT are growing smoothly but steadily and now the price is at a critical point, so b

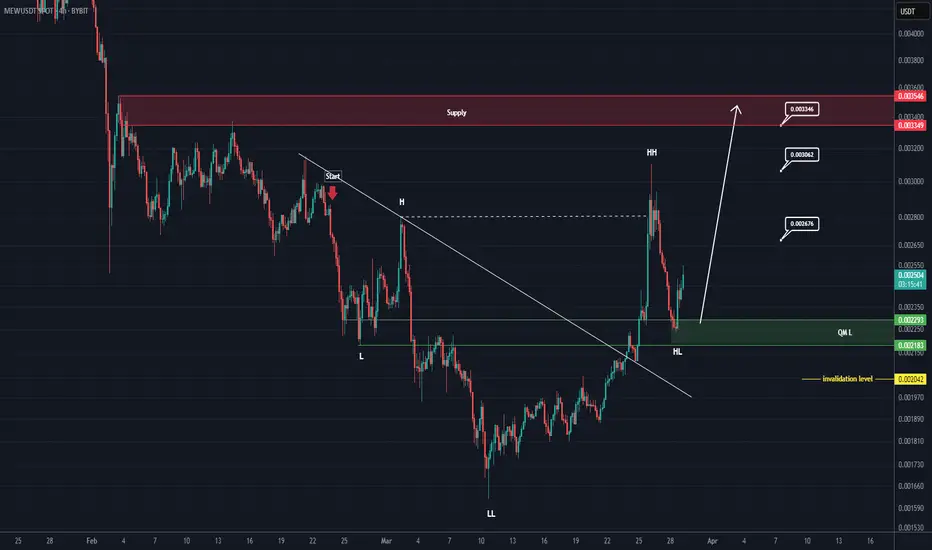
MEW Looks Bullish (4H)From the point where we marked start on the chart, MEW appears to be forming a bullish QM.
As long as the green zone holds, it can move toward the targets.
A 4-hour candle closing below the invalidation level will invalidate this pattern.
For risk management, please don't forget stop loss and cap
MEWUSDT Approaching a Breakout!MEWUSDT Technical analysis update
-MEWUSDT is trading within a pennant pattern on the daily chart.
-The price is currently above the 100 and 200 EMA.
-A bullish crossover between the 100 and 200 EMA could occur soon.
-There has been a notable increase in trading volume in recent days.
-The pric

MEWUSDT → False breakout of resistance after distributionBINANCE:MEWUSDT.P in the distribution phase is testing a strong resistance and liquidity zone against which it makes a false breakout.
Regarding the current situation, we should pay attention to several key levels - support and upper resistance. A retest of 0.00300 - 0.00312 is possible, the

Trading Idea for MEW: Potential LongThe MEW coin has been under pressure for a long time and has been testing buyer zones. A potential long entry may be forming at current levels. The possibility of upward movement remains, but it is crucial to manage risks and avoid excessive leverage. Monitor price action and confirmation signals.

After Bouncing From Support Point $MEW is Gearing for A Breakoutcat in a dogs world token ($MEW) launched Mar 2024 brought all the attention to the cat coin sector and was the driving force that kickstarted what crypto-natives call “cat season” as it crossed $900M+ market cap within days of its debut.
Built on the Solana ecosystem, $MEW has bounced from the psy

MEW buy/long setup (8H)It seems we have a diametric pattern on the chart, with its wave F currently completing.
The green zone is a high-potential area for a MEW, which could propel the price upward.
The target could be the red box.
Closing a daily candle below the invalidation level will invalidate this analysis.
For

Falling Wedge Breakout: Is MEW/USDT Ready to Surge?The chart analysis for MEW/USDT on the daily timeframe (1D) reveals a compelling narrative for potential bullish movement, underpinned by a falling wedge pattern breakout and subsequent confirmation of support levels. Each candle on the chart represents a day's worth of price action, capturing a lon

See all ideas
Summarizing what the indicators are suggesting.
Oscillators
Neutral
SellBuy
Strong sellStrong buy
Strong sellSellNeutralBuyStrong buy
Oscillators
Neutral
SellBuy
Strong sellStrong buy
Strong sellSellNeutralBuyStrong buy
Summary
Neutral
SellBuy
Strong sellStrong buy
Strong sellSellNeutralBuyStrong buy
Summary
Neutral
SellBuy
Strong sellStrong buy
Strong sellSellNeutralBuyStrong buy
Summary
Neutral
SellBuy
Strong sellStrong buy
Strong sellSellNeutralBuyStrong buy
Moving Averages
Neutral
SellBuy
Strong sellStrong buy
Strong sellSellNeutralBuyStrong buy
Moving Averages
Neutral
SellBuy
Strong sellStrong buy
Strong sellSellNeutralBuyStrong buy
Displays a symbol's price movements over previous years to identify recurring trends.