Tesla Wave Analysis – 13 May 2025- Tesla broke resistance area
- Likely to rise to resistance level 360.00
Tesla recently broke the resistance area between the round resistance level 300.00 (which stopped the previous waves 4 and (1)) and the 38.2% Fibonacci correction of the downward impulse (C) from January.
The breakout of this resistance area accelerated the active medium-term impulse wave (3) from the end of April.
Tesla can be expected to rise to the next resistance level 360.00, top of the previous wave 2 from February and the target price for the completion of the active impulse wave (3).
1TSLA trade ideas

TSLA daily trading (option)1. Key Level: TSLA was at a risky spot — it hit resistance and has been moving sideways, with about a 50/50 chance of going up or down.
2. Strategy Triggered: It dropped and then retested the 50 SMA on the H1 chart.
3. Pattern Observed: An uptrend breakdown.
➡️ I think TSLA could go up in the long term (next 1–2 weeks), but we might see a red candle tomorrow or Monday

TeslaFor the first time in Tesla's history, it broke monthly support back in Dec 22. Price came back to mitigate the supply level...and if I am right...just maybe...Tesla is within a distribution range...

TSLATesla is in a correction phase, the price has a chance to test the support zone 246-218. If the price can stay above 218, it is expected that the price will have a chance to rebound. Consider buying the red zone.
🔥Trading futures, forex, CFDs and stocks carries a risk of loss.
Please consider carefully whether such trading is suitable for you.
>>GooD Luck 😊
❤️ Like and subscribe to never miss a new idea!

BullflagFrom what I can see, a bull flag is forming. If it breaks out above, I see 340/360 as a possible target, which is also 50% of the decline from the all-time high.

Swing Trade Plan for TSLA (as of $285)TSLA has rallied from its previous consolidation zone and is approaching a potential resistance area between $290–$295. Momentum is solid, but RSI and volume trends may suggest we’re nearing short-term exhaustion.
✅ Strategy 1: Wait for the Pullback (Safer Play)
Entry zone:
• $240 – Ideal level near former resistance turned support
• $215 – Strong support with higher reward potential
Stop-loss:
• Below $200 (to protect against deeper trend reversal)
Profit targets:
• $265 – Conservative
• $290 – Re-test zone
• $355 – Bullish breakout continuation (if sentiment remains strong)
This setup gives room for the price to breathe and positions you after a healthy correction.
⚡️ Strategy 2: Momentum Breakout Trade (Aggressive)
Entry:
• On breakout above $295 with volume confirmation
Stop-loss:
• Below $280 (tight, breakout failure protection)
Target:
• $320, $340+, depending on follow-through
This is higher risk, higher reward — you’re betting on bulls continuing the charge without a pullback.
⚠️ Disclaimer: This is not financial advice. Trading involves risk. Always do your own analysis and trade with proper risk management.

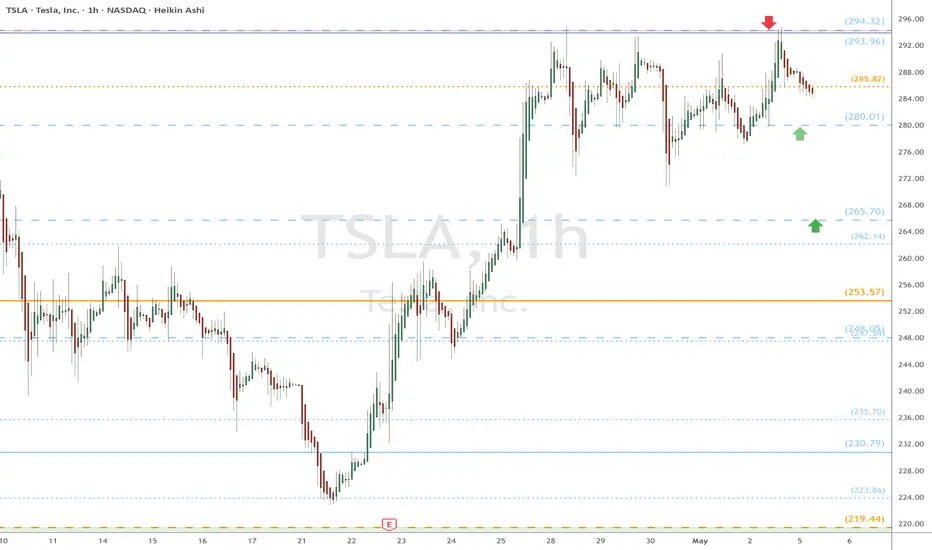
TSLA eyes on $294: Proven Resistance that bulls MUST break NOW TSLA back to a critical double fib resistance $293.96-294.32
Bulls MUST break and retest this as support and do it right now.
Any weakness could give a dip to fibs below at $280.01 or 265.70
Tesla (TSLA) 4-Hour Chart Analysis: BBofVWAP Strategy in ActionTesla Inc. (TSLA) has been gaining strong momentum lately, and on the 4-hour chart, my BBofVWAP strategy has shown a notable signal. In this post, I’ll walk through how this custom strategy works and what the latest price action could mean for traders.
🔍 What is the BBofVWAP Strategy?
The BBofVWAP (Bollinger Bands of VWAP) strategy I use combines two powerful tools:
VWAP (Volume-Weighted Average Price) – to anchor the trade bias
Bollinger Bands – to track volatility and determine key exit points
Here’s how it works:
✅ Entry Point: When VWAP crosses above the Pivot Point and stays within the Bollinger Bands.
💡 Exit Condition: VWAP crossing below the lower Bollinger Band signals an exit.
💰 Profit Booking:
Partial profits are taken near R3 resistance level
Or when the price drops below the upper Bollinger Band
This method filters out noise and rides trends effectively while maintaining solid risk management.
📊 Current TSLA Chart Insight (4h)
In the current 4-hour setup:
We entered the trade at a pivot breakout (highlighted with a blue arrow on the chart).
VWAP continued to trade within the Bollinger Bands, keeping the position alive.
Price has climbed toward $287.25 and is hovering near key resistance levels.
R3 (328.92) acts as a potential profit-taking zone.
If VWAP crosses under the lower band, we’ll be out – clean and disciplined.
📌 Why This Strategy Works
🎯 Clear rules-based system for entries and exits
📉 Eliminates emotional decision-making
⚖️ Balances trend-following with mean-reversion logic
🔁 Works well across large-cap, high-volume stocks like TSLA
🧠 Final Thoughts on TSLA Setup
Tesla’s recent strength, combined with this BBofVWAP setup, gives a bullish but cautiously managed outlook. As always, managing risk with technical levels like VWAP, Pivot Points, and Bollinger Bands provides a more structured approach to volatile tickers.

TSLA Technical Analysis🚀 TSLA Long-Term Buy Setup (Educational Trade Idea)
I’ve entered a long position on Tesla (TSLA) at $246.57 based on a clear technical breakout from a downtrend and consolidation pattern.
✅ Target: $487.66
❌ Stop Loss: $209.36
📊 Risk-Reward Ratio: 1:6.58 — extremely favorable setup
Price action shows a textbook breakout from accumulation, followed by bullish structure. This move aligns with the Smart Money Concept — entering after accumulation, not during uncertainty.
🕒 This is a long-term swing trade, meaning it could take weeks or months to fully develop.
⚠️ Disclaimer: This is not financial advice, but an educational breakdown for learning purposes. Always manage your own risk and do your own analysis before trading.

TSLA looks tired295 is seemingly the tough level. I was just praising TSLA for turning slightly bullish too. We rejected pretty hard Fri 5/2.
<285, 280, 275, 270... may even take out 265. I definitely think that TSLA is trying to hold the range and not breakdown. Stay conscious of each level if you are playing it and take profit.
FOMC Wed 5/7. I think that may determine a lot of opportunities for end of week.

Market appears supportive of Tesla's growth prospects**Direction:** **LONG**
**LONG Targets:**
- **T1 = $287.50**
- **T2 = $295.25**
**Stop Levels:**
- **S1 = $275.00**
- **S2 = $268.75**
---
**Wisdom of Professional Traders:**
This analysis synthesizes insights from thousands of professional traders and market experts, leveraging collective intelligence to identify high-probability trade setups. The wisdom of crowds principle suggests that aggregated market perspectives from experienced professionals often outperform individual forecasts, reducing cognitive biases and highlighting consensus opportunities in Tesla.
**Key Insights:**
Tesla continues to dominate the EV sector with substantial global market share and expanding demand across multiple territories. It has consistently outperformed competitors by innovating battery technologies and ramping up production capabilities. Recent improvements in cost efficiency and scaling production have reinforced positive outlooks from traders. Key focus areas include Tesla's development of its 4680 battery production and advancements in energy generation/storage, further suggesting a long-term competitive edge.
The broader market appears supportive of Tesla's growth prospects, particularly with EV subsidies and green energy initiatives in major economic regions. Tesla's brand recognition and consistent product releases continue to draw consumer attention, while strategic efforts like the buildout of gigafactories globally are seen as favorable catalysts for sustained revenue expansion.
**Recent Performance:**
Over the last week, TSLA has displayed steady consolidation and formed a strong technical base approximately near $280. This stability follows a significant bullish rally earlier in the month, and the stock now appears poised for a continuation to test resistance levels. Technical indicators such as the Relative Strength Index (RSI) remain within neutral-to-positive territory, while moving averages support the potential for upward trajectory amidst firm buying support.
**Expert Analysis:**
Analysts broadly expect Tesla to capitalize further on its technological leadership in the automotive market. Hedge funds and institutional investors have shown significant interest in maintaining long positions on Tesla due to growth-driven profitability and aggressive expansion. Experts view Tesla's ability to scale its production and integrate advanced AI technologies into the manufacturing process as differentiating factors in the industry.
Tesla's Q3 production and delivery targets have received favorable feedback, aligning with expectations of robust growth narratives. If global macroeconomic pressures ease, Tesla could benefit further from optimistic market dynamics, broadening its appeal among investors.
**News Impact:**
Tesla's recent progress in scaling production at its factories and updates on the highly anticipated Cybertruck have sparked renewed confidence in the company's product lineup and potential market penetration. News regarding expansions into new territories coupled with strategic collaborations in energy storage solutions bodes well for long-term growth. Positive sentiment in this area tends to support the general bullish narrative among professional traders and market participants.
**Trading Recommendation:**
Tesla exhibits strong fundamentals and resilient technical qualities conducive to a long play this week. Professional trader consensus supports a bullish stance, further backed by favorable news impacts and sustained market demand for Tesla vehicles and innovations. Maintaining stops near broader support levels while aiming for gradual upward price targets is recommended to balance risk and reward. Consider this a solid long opportunity for near-term price advancements.

TSLA technically turntUP... so the stock pops on a sob story. there will be action. pullback possible, but doesn't have to. 2-3 week rallies expected while the getting is good.
*weekly bullish close (engulfing)
*pullbacks should not be lower than prev week high (270 good)
*it's big tech earnings, so running during other strong tech success while down is a TSLA thing
tootles

TESLA: Bearish Continuation & Short Signal
TESLA
- Classic bearish formation
- Our team expects fall
SUGGESTED TRADE:
Swing Trade
Sell TESLA
Entry Level - 287.25
Sl - 299.67
Tp - 259.90
Our Risk - 1%
Start protection of your profits from lower levels
Disclosure: I am part of Trade Nation's Influencer program and receive a monthly fee for using their TradingView charts in my analysis.
❤️ Please, support our work with like & comment! ❤️

TSLA Bull CaseIf TSLA can put in a solid close above the 200sma and downtrend line I am bullish for the short-mid term at least up to the .38 fib at $320.

Will be an epic year for TSLAThis dip was a great oportunity to get in into Tesla, as Elon will be focus more into it. I spect a rally to 0.618 fib level for the next week, and a 5 waves up to a new price discovery for the next couple years.

$TSLA Weekly RecapNASDAQ:TSLA Weekly Recap
Market Structure: Price broke out of the downtrend with a strong bullish engulfing candlestick, indicating a potential reversal.
Market Bias: A healthy retracement occurred in alignment with market sentiment — this pullback may be necessary to support a stronger move toward all-time highs.
BX-Trender: The weekly histogram flipped from red to green, suggesting increased accumulation and potential for upward momentum.

$TSLA to 300 End of Year.. #DIAMOND Been nothing but free Alpha 101 on my page this white boy summer. Diamond bottom clear as day on trend line...
TSLA to 300 EOY = Wizard has spoken
Keepin it simple. This is a LONG PLAY like CVNA , will update/comment on idea if I see any potential option plays (200C's after June OPEX will be a target of mine)
I think the whole world is over lookin geopolitical threats atm, but computer algo feels NO FEAR... FEAR IS THE MIND KILLER
Trump Presidency required, Elon steps down as CEO causing 1 day buy the dip opp, Elon joins US Gov't as Tech Advisor, Elon does what Bootyjuice never could, MAGA...
"THIS IS AMERICA!" - 300

$TSLA Pullback Soon?Tesla's recent announcement of its upcoming robotaxi service and the unveiling of the Cybercab have generated significant investor enthusiasm, contributing to a notable surge in TSLA's stock price. However, while these developments are promising for Tesla's long-term vision, they may not provide sufficient support for the current elevated stock levels in the short term.
Competitors like Waymo and Zoox have already established operational autonomous ride-hailing services in select markets, potentially challenging Tesla's market entry and adoption rates.
Despite recent relaxations in federal self-driving regulations, Tesla's autonomous services must still navigate a complex landscape of state and local laws, which could impact the pace of deployment and revenue realization.

REJECTION OF $292Tesla's stock ( NASDAQ:TSLA ) has faced multiple rejections at key resistance levels. To establish a strong upward trend, it may require forming a triple bottom pattern. This would indicate a solid foundation for potential growth. It is anticipated that the stock will retest the $270 and $250 levels before making a decisive move.

TSLA Drill Team is Back
Against the background of everything that is happening, from a fundamental point of view, Tesla is facing significant headwinds as we approach its Q1 2025 earnings.
A 13% year-over-year decline in deliveries, ongoing margin pressures from price cuts, and negative consumer sentiment tied to Elon Musk’s political involvement are weighing on the company.
While the energy segment and potential updates on the affordable vehicle could provide some upside, the risk of a disappointing earnings report looms large, potentially exacerbating Tesla’s challenges in a competitive EV market.
Technically
We see that the price is consolidating near the lower boundary of the golden pocket on the FIBO channel on the 1-hour chart. For a few days now, the price has been holding just above the 240.00 support level, but the bearish trend remains dominant with 23 out of 26 technical indicators signaling bearish sentiment as of April 20, 2025.
Entry SHORT around 240$ targeting 220$
Post-earnings, we could see a breakdown below 220.00, targeting the next support at 216.00, from which the future prospects will depend.
Resistance levels: 270, 250, 240
Support levels: 220, 216, 210
The price is struggling to break above the resistance, consolidating over days. With earnings on Tuesday, there’s a high probability of a breakdown if the report misses expectations or lacks clear guidance on growth initiatives.
A break and consolidation below 230.00 could lead to a decline toward 220.00 or even 210.00 in the coming week.
However, if Tesla surprises positively—particularly with strong energy segment growth or clarity on the affordable vehicle—we might see a reversal. Still, the current setup suggests caution, and we’ll need to monitor the price reaction closely post-earnings.
Keep your long term vision NASDAQ:TSLA

TSLA | Buy @LTP | SL below 240 | 1st Target 360⚡ Tesla (TSLA) – Breakout from Demand Zone, Big Upside Potential
TSLA recently respected the strong demand zone around $220–$240 and has bounced sharply with increasing volume, signaling renewed buying interest. Price has now cleared immediate resistance and is forming higher lows a bullish sign.
📍 Entry: $282.16
🎯 Targets:
TP1: $330 (mid-level)
TP2: $367.34 (major resistance zone)
❌ Stop-loss: Below $242.79
This setup offers an excellent risk-to-reward ratio with a potential breakout rally if broader market sentiment supports tech.
Volume spikes confirm accumulation, and momentum indicators are likely flipping bullish. Keep an eye on price action near $300 for further confirmation.

Tesla: More Room in Wave 4With the recent increases, TSLA approached the more significant local high from early April. Although we locate the price in a turquoise downtrend impulse, the internal corrective upward move of wave 4 still has some more room. With the following wave 5, the stock should then fall below the support at $215.01 to complete the magenta wave (3), which is also part of a downtrend impulse. Meanwhile, our alternative scenario suggests a much faster progression. We consider it 27% likely that with the low on April 7, the blue wave alt.(II) and thus the major corrective movement have already ended. In this case, the path would be clear for a new uptrend of the blue wave alt.(III), which would lead to increases above the resistance at $488.50. Primarily, however, we expect the corrective movement to conclude at a later time and at lower levels.

