Another leg up? TSLA loaded wedgeLooking like it’s consolidating. Looking for another leg up if we get momentum.
Entry is my green ray. We have robotaxi info from last ER, I think it’s ready to move again. Not FA! But let me know what you think!
1TSLA trade ideas

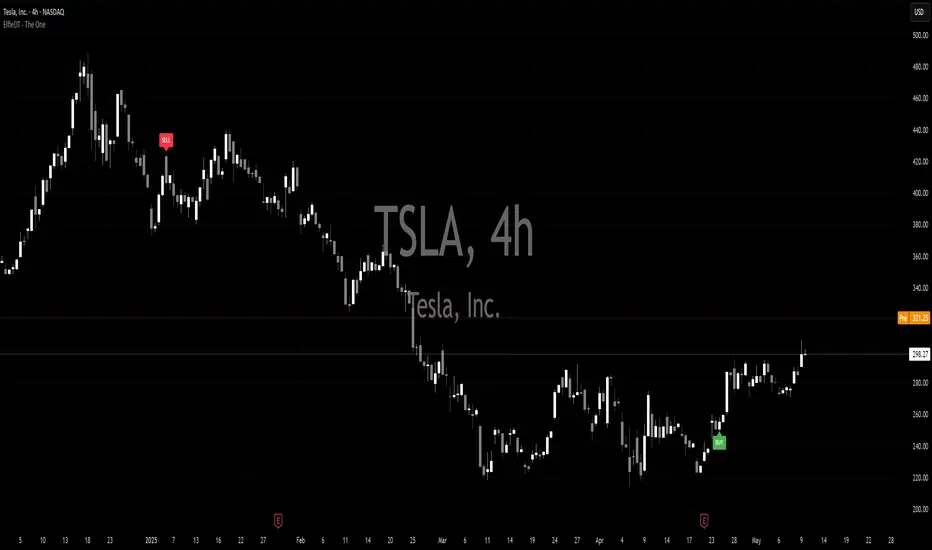
TSLA Break Volume profile + Lift High Lift LowFrom the TSLA image
1.) Decided to enter last Friday. Try measuring the Volume profile from the highest price to the present to see when there is frequent trading. It turns out that, hey, it has established a base.
2.) Looking at the pattern, it looks like a Triple bottom and seems to break through the Volume profile resistance and resistance line.
3.) Like the latest graph on Friday, it will be a High and Low lift.
So I guess it's either a Shoot or a Lose, with a Stop loss at the Low that was lifted up.

Tesla Breaks Key Resistance: Bullish Momentum Signals $314 Targe
Current Price: $298.26
Direction: LONG
Targets:
- T1 = $307.00
- T2 = $314.00
Stop Levels:
- S1 = $295.50
- S2 = $289.40
**Wisdom of Professional Traders:**
This analysis synthesizes insights from thousands of professional traders and market experts, leveraging collective intelligence to identify high-probability trade setups. The wisdom of crowds principle suggests that aggregated market perspectives from experienced professionals often outperform individual forecasts, reducing cognitive biases and highlighting consensus opportunities in Tesla.
**Key Insights:**
Tesla’s stock has successfully broken through significant resistance levels following strong earnings and heightened confidence in its growth strategy. The company’s continued investment in Full Self-Driving (FSD) technology offers a significant upside potential, particularly as market optimism around autonomous driving accelerates. Additionally, Tesla’s high trading volume and favorable gamma exposure suggest sustained bullish momentum for the near term. However, traders must remain cautious about valuation concerns, which persist due to the stock’s high price-to-earnings ratio and underlying market risks.
Tesla’s ambitious expansion strategies, including continued realignment of electric vehicle production and penetration in key global markets like China and Europe, make it uniquely positioned to grow further despite macroeconomic challenges. The short-term trajectory is driven by strong technical indicators and supportive market sentiment, making it a compelling candidate for long positions.
**Recent Performance:**
Tesla’s price has surged over 35% since its recent earnings report, riding the wave of high investor enthusiasm and strategic achievements. Its bullish momentum is reinforced by favorable technical setups, including MACD and RSI indicators that signal a continuation of the uptrend. The stock has outperformed other high-beta peers in the electric vehicle and technology sectors, reflecting a strong fundamental and technical foundation for further price appreciation.
**Expert Analysis:**
Market analysts highlight Tesla’s ability to consistently innovate across its product lines while maintaining high operating margins. Despite lingering valuation questions, the stock’s bullish trend remains supported by a robust narrative and growing speculative interest. Strategists are particularly optimistic about Tesla’s advancements in FSD technology and its ability to capture additional market share in ride-hailing and autonomous driving sectors. The company’s recent focus on leveraging artificial intelligence within its vehicle software and energy storage solutions has also fueled optimism among traders.
**News Impact:**
Recent developments in U.S.-China trade policies and economic stimulus measures amplify Tesla’s growth prospects in its largest international market—China. The company’s ongoing efforts to scale its FSD systems globally have garnered significant attention, further supporting long-term bullish sentiment. Additionally, increased option trading activity and Tesla’s exposure to high-volatility events contribute to its price action, offering traders opportunities to capture gains in the near term. Investors should watch closely for updates on international car deliveries and additional announcements regarding Tesla’s strategic initiatives.
**Trading Recommendation:**
Traders should consider taking a long position on Tesla as it exhibits sustained bullish momentum driven by technical breakout patterns, high investor sentiment, and strategic advancements. With Tesla poised to capitalize on macroeconomic tailwinds and sector-specific growth drivers, the stock is likely to test $314 as a near-term price target. Ensure proper risk management by placing stop levels at $295.50 and $289.40.
```

TESLA - LONGSAs you can see - our indicator works on any and all instruments you would like to trade....
You can search for the indicator - as we made a DEMO version available.
However to get the full version - you will need to follow and contact us!
Trade Review (TSLA)Trade Review (TSLA)
key notes
- displacement -> consolidation. no bearish CISD or MSS on higher time frames
- pullback into OTE of original displacement
- unswept liquidity targets
- 4hour bullish market structure shift
- displacment, creation of a HTF fair value gap and retracement into fair value gap (Entry)
- exit at internal buyside liqudity

TSLA at the Crossroads: Multi-Pattern Breakout Brewing at 288
📈 TSLA 4H Chart Analysis – A Confluence of Multiple Technical Patterns
TSLA is currently forming a highly significant confluence zone around the 288 level, acting as a key neckline that's been tested and established over multiple sessions. This isn't just a single pattern at play — it's a combination of several overlapping structures across different perspectives.
🔍 Pattern perspectives observed:
Cup & Base
Cup & Handle
Inverse Head and Shoulders
Multi-VWAP Support Zones
Each pattern aligns differently, but all converge around the 288 price level, making it a critical zone of structural importance.
📊 Supporting momentum and confirmation signals:
RSI has broken above the zero line, showing clear buyer strength
Awesome Oscillator (AO) signals a strong reaccumulation phase
Price has successfully broken out above the 294.86 resistance zone, indicating a shift in trend
Multiple timeframes (2m to 4H) are in full alignment with Buy signals
💬 Conclusion:
TSLA is entering a potential breakout phase, driven by a powerful confluence of technical patterns all meeting at the 288 neckline. With momentum confirmed and buying pressure in control, the probability of TSLA rallying from 288 toward the 360 zone is notably high.
Disclaimer:
This analysis is for informational and educational purposes only and does not constitute financial advice. Trading stocks involves significant risk, and you should only trade with funds you can afford to lose. Always do your own research or consult with a licensed financial advisor before making trading decisions.

Why I'm not holding Tesla Tesla was dropping! I got in at around 220. However, within three weeks, I sold for a small profit.
BUT, why did I sell? This is why I'm not holding NASDAQ:TSLA
It's time to buy!
From a technical and historical point of view, buying Tesla right now makes perfect sense. The stock has a history of making significant price gains, is currently oversold, and is testing key support areas, such as the monthly 50 SMA.
A trader or investor who is 100% technical-based, this stock looks like a dream.
However, all the hype hits the floor when the fundamentals are considered...
Meh...
✔ The company has been increasing sales and cash year-on-year until recently
✔ Tesla has plenty of cash and assets. A simple acid test ratio shows liabilities vs. assets around 1:2.
❌ The issue is profit. Both gross and net profit margins have been falling year-on-year. The net profit margin is down from 15% two years ago to 7% last year.
❌ Worse, the current forecasts predict decreased sales and other key financials.
Poor and worsening financials are a clear red flag when buying stocks. Stay away. No matter how appealing the price looks.
Don't get me wrong, I don't think Tesla is doomed, and it may still yield returns. However, I would not be surprised if the stock consolidates or moves lower from here. For me, Tesla is not the significant buy it once was.

$TSLA trading opportunitiesObjectives:
- Trade objective is to build a full position into TSLA before market recognises FSD revenue
- Happy to accumulate more, to lower average cost
What happened:
- Market structure for TSLA remains bullish in the mid to long term with Market Bias indicator maintaining green
- Observed weaker BX-trender indicator on daily basis, suggesting weaker purchases from market movers
- short term topped at $290s
- expecting some pull back to smart money buy zone at $260s - $270s
Next steps:
- i will take long position into TSLA at smart money buy zone

Mid Week Market Update (April 30, 2025)Just a little quick mid week update on the markets so far looking at AMEX:SPY NASDAQ:QQQ NASDAQ:TSLA TVC:USOIL NASDAQ:META NASDAQ:MSFT

Is a Tesla Stock Rebound Imminent?Tesla's stock has recently faced volatility, partly due to first-quarter 2025 delivery figures that did not meet some market expectations. Despite this, several significant factors suggest a potential for upward movement in the share price. As the stock hovers around $292 in late April 2025, market observers are closely watching for catalysts that could shift sentiment and drive value appreciation for the electric vehicle and energy company.
Key indicators pointing towards a potential rebound include notable insider activity and the highly anticipated launch of a dedicated robotaxi service. A Tesla board member and Airbnb co-founder recently purchased over $1 million in TSLA stock, marking the first insider buy of this magnitude in approximately five years. This action signals strong internal confidence. Furthermore, the planned June launch of a robotaxi service in Austin, Texas, using autonomous Model Y vehicles, is viewed as a transformative step that could open substantial new revenue streams and redefine Tesla's market position.
Adding to the bullish sentiment is unusual activity in the options market, where a significant investor placed a large bet on a substantial price increase in the near term through out-of-the-money call options. While recent delivery misses and concerns regarding external factors have contributed to past stock pressure, the combination of insider conviction, a looming disruptive service launch, and aggressive bullish options trading suggests that the market may be poised for a significant reaction to upcoming positive developments. Investors are keenly focused on the successful execution of the robotaxi strategy as a critical determinant of future stock performance.

Long TSLA if it opens up tomorrow. Could get bad if it drops.
TSLA Buy/Hold/Sell zones. Huge green area if it opens higher tomorrow.

Daily Price Action: TSLA Tuesday 4/29/2025In this video, we will be looking into the potential price action TSLA.

Diamond Top Pattern📉 Diamond Top Formation in Play?
This isn’t just a triangle—look closer.
What started as broadening volatility on the left has now tightened into a textbook Diamond Top, typically signaling a bearish reversal after a strong impulse move up.
⚠️ Key Signals:
• Left side expansion → Right side contraction = structural symmetry.
• Major EQH and liquidity sitting right above.
• Supply zone pressure at the top.
• Watch for a false breakout trap to liquidate late longs.
🔍 Confirmation = breakdown below rising trendline + spike in volume.
🧠 Smart money doesn’t trade patterns—they engineer them.
This one? It’s baiting breakout traders before a potential liquidity flush.
📊 Plan Ahead:
• Breakdown = short with momentum.
• Breakout = wait for trap/fakeout and fade the rally if supply holds.
⸻
💬 What do you see? Trap setup or trend continuation?

Tesla Bullish, Let Me ExplainYesterday's high was the highest price since 4-March 2025, almost two months ago. The fact that TSLA moved out of bottom prices and strong long-term support zone while challenging resistance is a bullish signal.
The prices that were activated in Mach and April as support is the same range that TSLA used back in 2024 to launch the previous bullish wave. The same prices as in October and September 2024. The same levels were activated but as a higher low. Clearly a bullish dynamic.
For this setup to be bearish, the action would have to go lower and print a lower low compared to August 2024, this isn't the case. We have a strong higher low which means that buyers were eager to enter the market and waiting for this long-term support zone to be activated. As soon as it was activated buyers showed up and this is confirmed by current price action. Short-term, Tesla is moving up.
This is short-term because a new bullish wave is just now getting started but the fact is pointing towards additional growth.
Yesterday TSLA closed above EMA55 daily for the first after hitting support since October 2024. Once EMA55 gets challenged and conquered, we are looking at the least 2-3 months of bullish action. Don't get me wrong, there can be swings short-term, shakeouts and such but no new lows. The low has been set 7-April 2025, from this point on, we will see growth.
Once a strong resistance level is challenged, we can look at the chart and see if there will be a major correction or just a retrace before additional growth. The truth is that the stock market is set to go higher, TSLA is just one stock. The SPX, NVDA, Bitcoin and many other instruments will grow. Everything will grow.
Namaste.

TSLA is BullishPrice was in a strong downtrend, however the bullish divergence with a proper reversal pattern of double bottom hints the return of bulls. If previous lower high is broken with good volume then we can expect a bullish reversal as per Dow theory. Targets are mentioned on the chart.

TSLA Long-term Key LevelsIdentified Long-term Key Levels for TSLA
Disclaimer:
The information provided on this TradingView account is for educational and informational purposes only and should not be construed as financial advice. The content shared here reflects personal opinions and is not a recommendation to buy, sell, or hold any financial instrument. Trading and investing involve substantial risk and are not suitable for every investor. You should carefully consider your financial situation and consult with a financial advisor before making any investment decisions. Past performance is not indicative of future results. We do not guarantee the accuracy, completeness, or timeliness of the information provided. Use the information at your own risk.

TSLA 4H chart analysisPrice: 275.59, down 3.28%.
Trend: Bearish (red TrendShift), confirmed by MACD (bullish momentum fading).
Support: 222.79 (strong, multiple tests).
Resistance: 274.68 (recent high, failed breakout).
Volume: 11.2M, declining on upticks, suggesting weak buying pressure.
Indicators: MACD bearish crossover, TrendConfirm bearish.
Outlook: Likely to test support at 222.79; break below could target 200.00. Resistance at 274.68 caps upside.
Price Action with S/R and MACD

The best area for long positionThe butterfly emerged from the cocoon in the ascending channel and now prepares to fly !!!!

TESLA Will Collapse! SELL!
My dear subscribers,
TESLA looks like it will make a good move, and here are the details:
The market is trading on 284.90 pivot level.
Bias - Bearish
My Stop Loss - 295.68
Technical Indicators: Both Super Trend & Pivot HL indicate a highly probable Bearish continuation.
Target - 265.94
About Used Indicators:
The average true range (ATR) plays an important role in 'Supertrend' as the indicator uses ATR to calculate its value. The ATR indicator signals the degree of price volatility.
Disclosure: I am part of Trade Nation's Influencer program and receive a monthly fee for using their TradingView charts in my analysis.
———————————
WISH YOU ALL LUCK

$TSLA back to $148-155 before correction is overDespite the bounce over the last few days, TSLA's price action is still bearish overall.
I think it's likely that we find resistance here or at $290, and then work our way back down to the lower support levels at $148-155.
I think once we get down to those levels, it'll be a good long term buy and we can see price go back to $700+.

Did Redditors make any money on TSLA?I thought I read that NASDAQ:TSLA was going down and Elon was going broke. Earnings were going to assure it. Looks like it came and went and instead went bullish. Oh well, you can't rely on narratives: Only Technicals!
The 218.65 Volume Profile Level has been holding TSLA up for weeks now. Great long by the way. And as long as it holds the next major VP level would be 183.63.
Now though TSLA is caught in a range and this does seem to be the top. If haters had just waited for a signal instead of trading on emotions they could have played this short from a higher price and with Earnings IV crush already over.

TESLA: Is Tesla a BUY Now? TESLA: Is Tesla a BUY Now?
In this video, I provide a detailed breakdown of Tesla's trading scenario, analyzing how it might unfold and identifying key moments to take profits.
You may watch the video for further details!
Thank You and Good Luck!

TSLA Bull or bearish NASDAQ:TSLA 28-04.2025
TSLA is looking suspicious, but the market is still bearish until proven otherwise other words until price moves back and above the fair value gap in the S&P 500 and re establishes up trend. Price can add on to the confirmation of the newly broken resistance and then rebound for further confirmation and then add on upward. Or this will turn out to be a more likely false break out and then bounce back into then consolidation chamber.
