MKR/USDT 4h chart ReviewHello everyone, let's look at the 4H MKR chart to USDT, in this situation we can see how the price moves on the created upward trend line. Going further, let's check the places of potential target for the price:
T1 = $ 1576
T2 = 1657 $
Т3 = 1714 $
Let's go to Stop-Loss now in case of furthe

MKR READY FOR PUMP AFTER RETESTMKRUSDT did market shift, as did sweep of previous low liquidity and did BOS. Will look for long positions in marked FVG areas.

Maker ready to go balistic!- trading within what appears to be a descending broadening wedge for the last year
- with ETH likely heading towards at least 2.6k for a mean reversion play, it is very likely Maker is one of the coins that benefit from ETH strength the most
- target of the formation is SUBSTANTIALLY higher

SHORT MKR Big 3 shorts looks like appearing big distribution
reflection on a 15 minutes from them
appearing big volumes and divergence with TOTAL3 and BTC ( MKR are not growing instead of them )

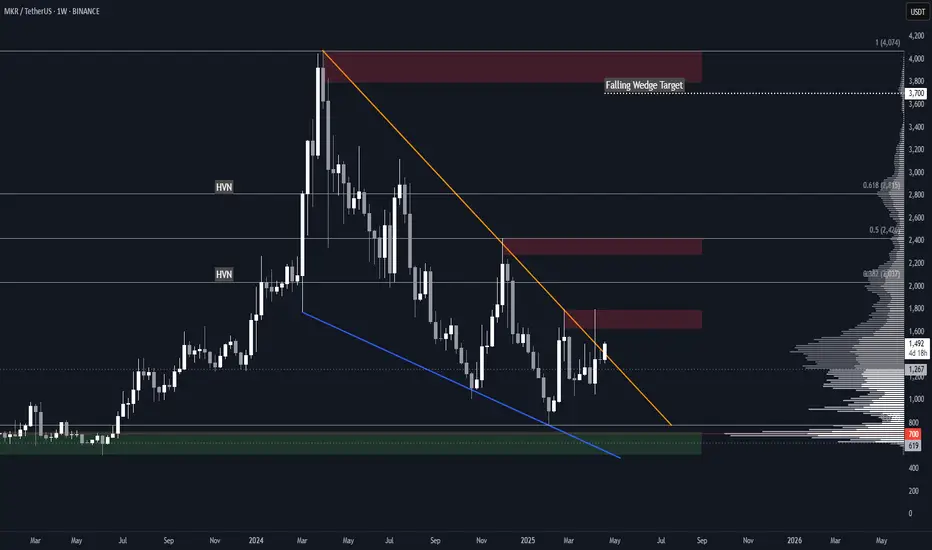
MKR Falling Wedge Breakout + Target & Key LevelsBINANCE:MKRUSDT just broke out of a 1-year long falling wedge, see 1D zoom below.
Further confirmation would be either:
• Daily retest of the resistance as support
• Weekly close above the resistance
Key Levels to Watch
Aside from the demand zone, these are all potential resistances and goo
$MKR Short IdeaWe are seeing another lower high being made with the strong rejection on the 200EMA on the 6H time frame. Looking for a breakdown into a new lower low around ~1,000

MKRUSDTmy entry on this trade idea is taken from a point of interest above an inducement (X).. I extended my stoploss area to cover for the whole swing as price can target the liquidity there before going as I anticipate.. just a trade idea, not financial advise
Entry; $01390
Take Profit; $1267
Stop Los

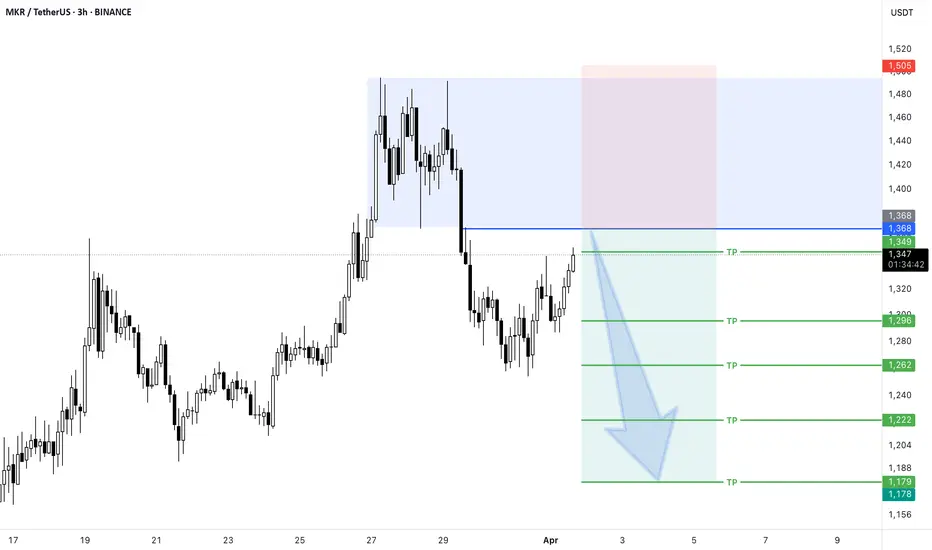
Short Position MKR/USDT#Singal
MKR/USDT
🔴 Short Position
🎲 Entry @ 1,368
✅ Target1@ 1,349
✅ Target2 @ 1,296
✅ Target3 @ 1,262
✅ Target4 @ 1,222
✅ Target5 @ 1,179
❌ Stop Loss @ 1,505
Leverage: 5X_15X
Margin: 10% of Wallet Balance
⚠️"Take Care of Risk Management for Your Account"
MKR Looks Bearish (1D)The correction of MKR seems to have started from the point marked START on the chart.
This correction appears to be a diametric pattern, and we are now in the late stages of wave F, which has been a bullish wave.
It is expected that from the red zone, wave G a bearish wave will begin.
The closure

MKRUSDTmy entry on this trade idea is taken from a point of interest below an inducement (X).. I extended my stoploss area to cover for the whole swing as price can target the liquidity there before going as I anticipate.. just a trade idea, not financial advise
Entry; $1185
Take Profit; $1281
Stop Loss

See all ideas
Summarizing what the indicators are suggesting.
Oscillators
Neutral
SellBuy
Strong sellStrong buy
Strong sellSellNeutralBuyStrong buy
Oscillators
Neutral
SellBuy
Strong sellStrong buy
Strong sellSellNeutralBuyStrong buy
Summary
Neutral
SellBuy
Strong sellStrong buy
Strong sellSellNeutralBuyStrong buy
Summary
Neutral
SellBuy
Strong sellStrong buy
Strong sellSellNeutralBuyStrong buy
Summary
Neutral
SellBuy
Strong sellStrong buy
Strong sellSellNeutralBuyStrong buy
Moving Averages
Neutral
SellBuy
Strong sellStrong buy
Strong sellSellNeutralBuyStrong buy
Moving Averages
Neutral
SellBuy
Strong sellStrong buy
Strong sellSellNeutralBuyStrong buy
Displays a symbol's price movements over previous years to identify recurring trends.