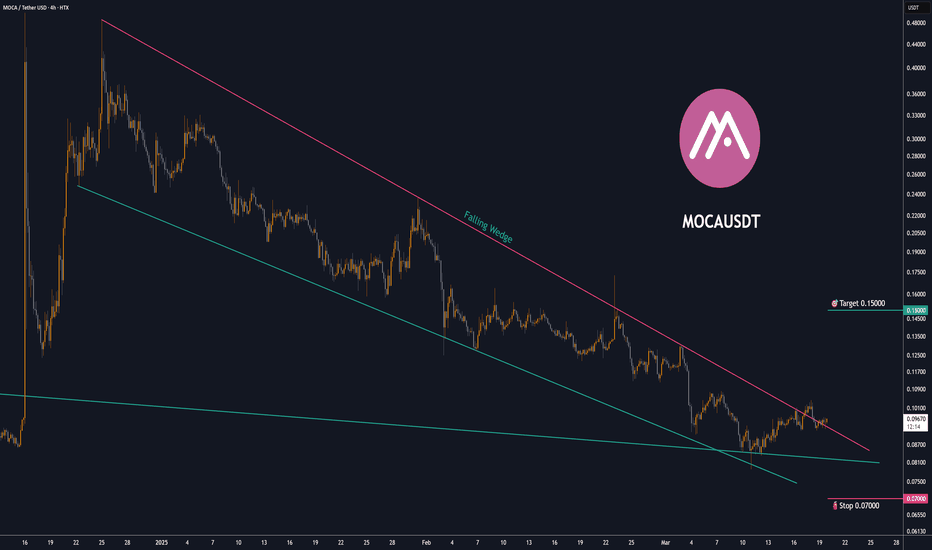
MOCA buy/long setup (4H)After hitting an origin zone, a bullish iCH has formed on the chart, and a trigger line has been broken.
We are now looking for buy/long positions in the demand zone, targeting the levels marked on the chart.
A daily candle closing below the invalidation level will invalidate this outlook.
Do not
MOCAUSDT: Oversold, Yet Ready to Explode? The Market Decides!Is the Bottom In? MOCAUSDT Flashes Buy Signals!
The crypto market never sleeps, and neither do opportunities. MOCAUSDT is currently hovering at $0.18582, down a staggering 62% from its all-time high of $0.48845 recorded just 39 days ago. But is this decline setting the stage for a major comeback?
MOCA/USDTKey Level Zone: 0.1780 - 0.1800
HMT v5 detected. The setup looks promising, supported by a previous upward/downward trend with increasing volume and momentum, presenting an excellent reward-to-risk opportunity.
HMT (High Momentum Trending):
HMT is based on trend, momentum, volume, and market struc
MOCA/USDT: READY FOR A BIG PUMP!!🚀 Hey Traders! 👋
If you’re loving this setup, smash that 👍 and hit Follow for proven trade ideas that actually deliver! 💹🔥
MOCA is currently trading within a symmetrical triangle on the 4-hour chart and bouncing perfectly off the lower trendline. A solid breakout from this structure could lead to
MOCA is at the end of its trend (2H)From the point where we placed the green arrow on the chart, MOCA appears to have formed a large triangle.
It seems that wave C of the large triangle is a double combination, and we are currently in the second part of this combination, which is itself a triangle.
At present, we appear to be in wav
Moca/usdt altcoin shortJust now opened a short position on this altcoin. Seems like its gonna have a weekly correction. Bitcoin also falling so I think that's good confluence in-terms of correlation.
Its bullish on weekly and daily but bearish on 4hr and lower timeframes.
Am aiming for .18
Could fall lower but might ge
See all ideas
Summarizing what the indicators are suggesting.
Oscillators
Neutral
SellBuy
Strong sellStrong buy
Strong sellSellNeutralBuyStrong buy
Oscillators
Neutral
SellBuy
Strong sellStrong buy
Strong sellSellNeutralBuyStrong buy
Summary
Neutral
SellBuy
Strong sellStrong buy
Strong sellSellNeutralBuyStrong buy
Summary
Neutral
SellBuy
Strong sellStrong buy
Strong sellSellNeutralBuyStrong buy
Summary
Neutral
SellBuy
Strong sellStrong buy
Strong sellSellNeutralBuyStrong buy
Moving Averages
Neutral
SellBuy
Strong sellStrong buy
Strong sellSellNeutralBuyStrong buy
Moving Averages
Neutral
SellBuy
Strong sellStrong buy
Strong sellSellNeutralBuyStrong buy
Displays a symbol's price movements over previous years to identify recurring trends.


