MTL Rebuy Setup – Perfect Entry Ahead! (3D)MTL (Metal DAO) is currently developing within Wave C of a classic diametric pattern, based on Elliott Wave theory. This structure suggests a high-probability corrective phase that typically leads to sudden and sharp movements before a potential reversal.
As of now, MTL has not yet reached the iden

MTLUSDT // Cup handle formationAlthough there is a cup-handle formation on the chart, the targets are determined according to Fibonacci. As a formation condition, we need closings above 0.804.

MTLUSDT 1WMTL ~ 1W Analysis
#MTL Buy gradually from here with a short -term target of at least 20%+.

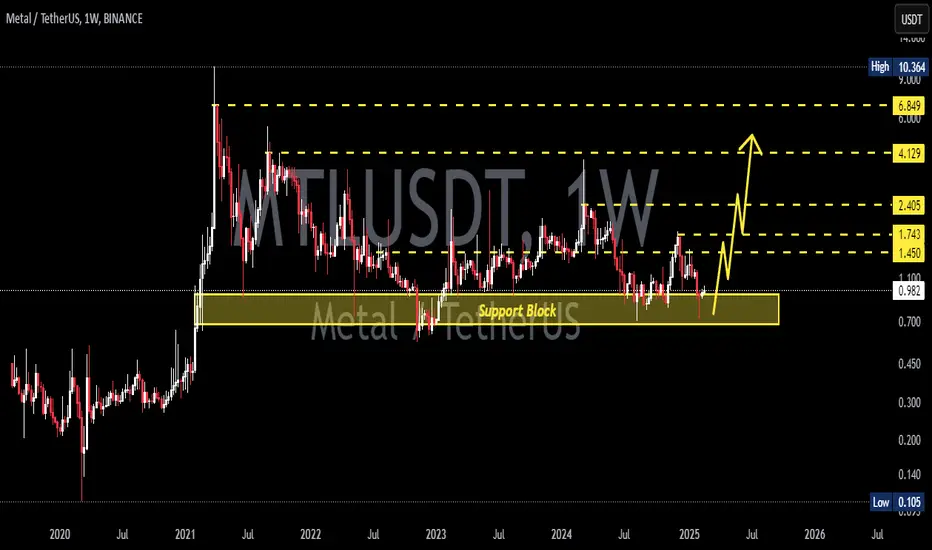
MTLUSDT 1WMTL ~ 1W Analysis
#MTL So far it continues to maintain this support block. Buy gradually from here if you still have a Conviction on this Coin.
MTLUSDT | AN OPPORTUNITY MIGHT OCCUR BUT BE CAREFUL!MTLUSDT looks strong, although there is a possibility of clearing the monthly liquidity line below.
In the S/R Flip area shown in the chart,
You can enter when the resistance in the support area, which is currently working as resistance, is broken with volume and turns into support.
Low Timefra

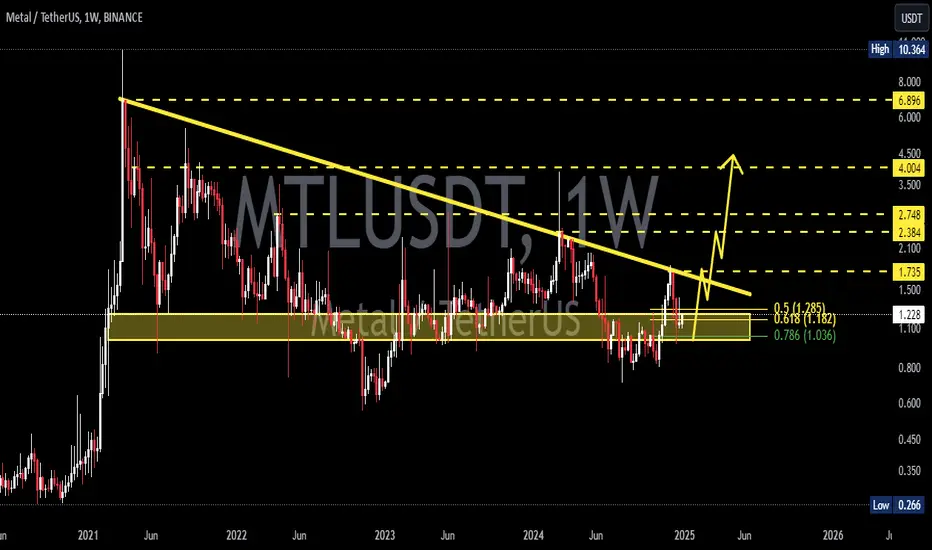
MTLUSDT 1WMTL ~ 1W
#MTL If you still have Conviction on this coin,. Buy gradually within this support block,. with a target of 20%+
#MTL/USDT Ready to go higher#MTL
The price is moving in a descending channel on the 1-hour frame and sticking to it well
We have a bounce from the lower limit of the descending channel, this support is at 1.10
We have a downtrend on the RSI indicator that is about to be broken, which supports the rise
We have a trend to st

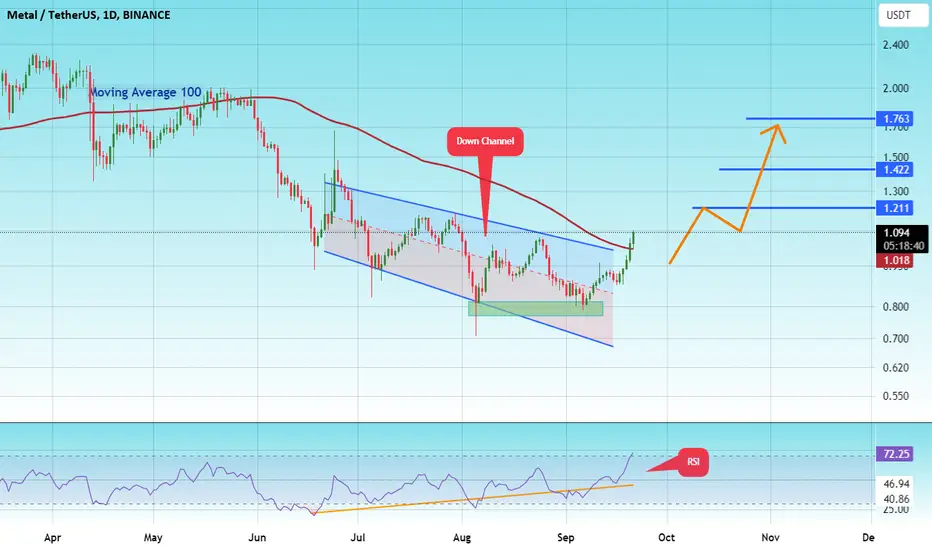
#MTL/USDT#MTL
The price has broken the descending channel on the 1-day frame upwards and is expected to continue.
We have a trend to stabilize above the 100 moving average again.
We have an upward trend on the RSI indicator that supports the rise by breaking it upwards.
We have a support area at the lowe
Metal DAO (MTL) about to print a 2500% move?On the above weekly chart price action has corrected over 90% since early 2021. A number of reasons now exist to be long, including:
1) Price action and RSI resistance breakouts.
2) Support and resistance. Look left. Price action has now confirmed support on past resistance.
3) A weekly life cros

MTL/USDT is on the verge of a big breakout!🚀 MTL/USDT is on the verge of a big breakout! 🚀
The MTL/USDT trading pair is showing promising signs of a potential breakout as it nears a critical resistance level. 📈 If it manages to break through, it could spark a strong bullish rally, driving prices higher. 🔥
💡 Here’s what to watch for:
- Ke

See all ideas
Summarizing what the indicators are suggesting.
Oscillators
Neutral
SellBuy
Strong sellStrong buy
Strong sellSellNeutralBuyStrong buy
Oscillators
Neutral
SellBuy
Strong sellStrong buy
Strong sellSellNeutralBuyStrong buy
Summary
Neutral
SellBuy
Strong sellStrong buy
Strong sellSellNeutralBuyStrong buy
Summary
Neutral
SellBuy
Strong sellStrong buy
Strong sellSellNeutralBuyStrong buy
Summary
Neutral
SellBuy
Strong sellStrong buy
Strong sellSellNeutralBuyStrong buy
Moving Averages
Neutral
SellBuy
Strong sellStrong buy
Strong sellSellNeutralBuyStrong buy
Moving Averages
Neutral
SellBuy
Strong sellStrong buy
Strong sellSellNeutralBuyStrong buy
Displays a symbol's price movements over previous years to identify recurring trends.