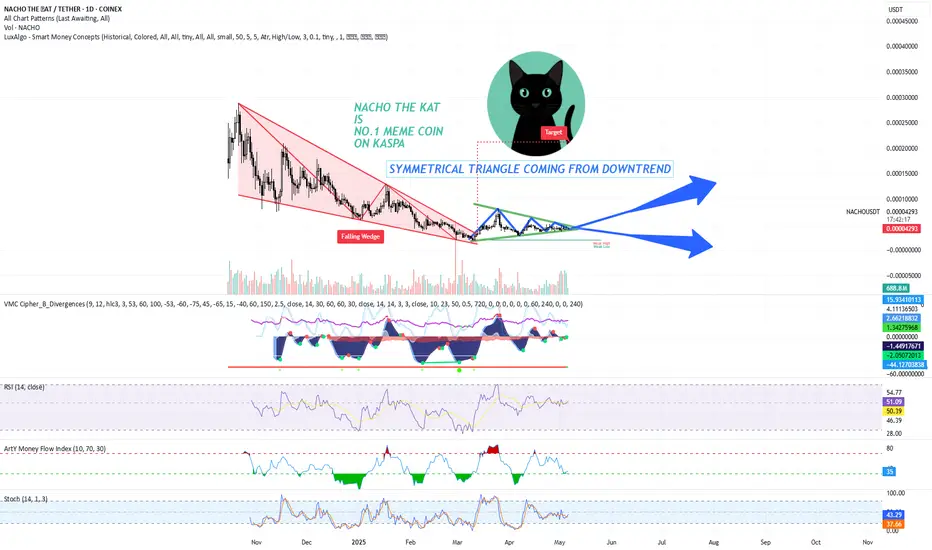
NO.1 MEME COIN ON KASPA IS NACHO THE KAT - DYORThe chart shows a symmetrical triangle pattern forming after a falling wedge. A falling wedge is typically seen as a bullish reversal pattern, indicating that the price may break out to the upside after the convergence of the trendlines. The symmetrical triangle, which is forming after the falling wedge, suggests consolidation before the breakout, likely pointing towards higher price action.
Key Points
Price Action and Trend:
NACHO has been in a downtrend, creating a falling wedge. The falling wedge has converging trendlines, which is a common setup for a bullish breakout.
Currently, the price is consolidating within a symmetrical triangle pattern, with lower highs and higher lows, indicating indecision in the market. The breakout from this triangle is likely to be significant, either continuing the previous downtrend or initiating a bullish reversal.
Volume Analysis:
The volume profile at the bottom shows an increase in volume as the price approaches the apex of the symmetrical triangle, suggesting potential strength behind the breakout.
It's important to monitor if volume increases further upon breakout to confirm the strength of the move.
Key Indicators:
RSI (Relative Strength Index): The RSI is currently around 50.39, suggesting a neutral market sentiment. The RSI has been ranging between oversold and overbought territories, which indicates that NACHO has not yet entered a strong trend but may be preparing for one.
Stochastic RSI: The Stochastic RSI is hovering around 37.57, showing a neutral stance, but it is closer to the oversold region, which could indicate that NACHO is near a potential reversal.
Money Flow Index (MFI): The MFI is at 35, indicating that the market is not yet in a strong buying or selling pressure zone. This shows that there is room for price movement based on volume.
VMC Cipher B Divergences: Positive divergence could suggest bullish momentum emerging, even if the price remains in consolidation.
Target and Resistance Levels:
If NACHO breaks out to the upside from the symmetrical triangle, the target is likely near the upper trendline of the wedge, which aligns with previous highs, possibly reaching the 0.00004500-0.00005000 USDT range.
Immediate resistance is near the 0.00004300 price level.
Support levels to watch are 0.00003000 and 0.00002000, which are key levels from previous price action.
Trading Plan
Entry Strategy:
Breakout Strategy: A strong breakout above the upper trendline of the symmetrical triangle would be a potential buy signal. If the price breaks and closes above 0.00004200, consider entering a long position with a target at 0.00004500-0.00005000.
Volume Confirmation: Ensure that the breakout is accompanied by an increase in volume. A low-volume breakout could be a false signal.
Stop-Loss Strategy:
Initial Stop-Loss: Place a stop-loss just below the symmetrical triangle's lower trendline or 0.00003000. This provides a reasonable distance to avoid being stopped out on small fluctuations.
Trailing Stop: As the price moves up towards your target, consider adjusting your stop-loss to lock in profits, especially if the price exceeds the 0.00004300 resistance level.
Take-Profit Strategy:
First Profit Target: Set a take-profit order around 0.00004500, the first resistance level. This is a key point based on the historical price action and previous swing highs.
Secondary Target: If the price breaks past 0.00004500, adjust the target to 0.00005000, which is the next logical resistance zone.
Risk Management:
Position Sizing: Risk no more than 1-2% of your total capital on this trade. For example, if your trading account is $5,000, you should risk no more than $100-$150 per trade.
Risk-Reward Ratio: Aim for a minimum 2:1 risk-to-reward ratio. For example, if you risk $150 on a trade, aim for a potential reward of $300 or more.
Additional Considerations:
Market Sentiment: As NACHO is a meme coin, market sentiment plays a huge role. Watch for social media trends and any news related to meme coins or Kaspa-based coins that could drive the price action.
Macro Conditions: Stay updated on the general market conditions for cryptocurrencies, as a broader downtrend in the market could limit the upside potential, even if technicals suggest a breakout.
NACHO THE KAT presents a technical setup with the potential for an upward move following a breakout from the symmetrical triangle. A close watch on volume and key price levels will be critical for confirming the breakout and determining the right moment for entry.
NACHOUSDT trade ideas
Only a 75% dump comingThis valueless cat token is only gonna dump 75% in a couple of days so do not worrry or panic sell this valueless token. Keep holding it watch the value leave the body of the cat!

nacho 100X-500X possible #1 kaspa memeMeme on kaspa
100X-500X possible in this bull run
amke rich with this kaspa meme

Nacho long On #1 kaspa meme 100X-500X possible in this bull cycle
focus and invest some money on kaspa meme
make financial rich ofrever
