Bullish BatPossible stop below 146.8
Possible T2 225.8 to 245
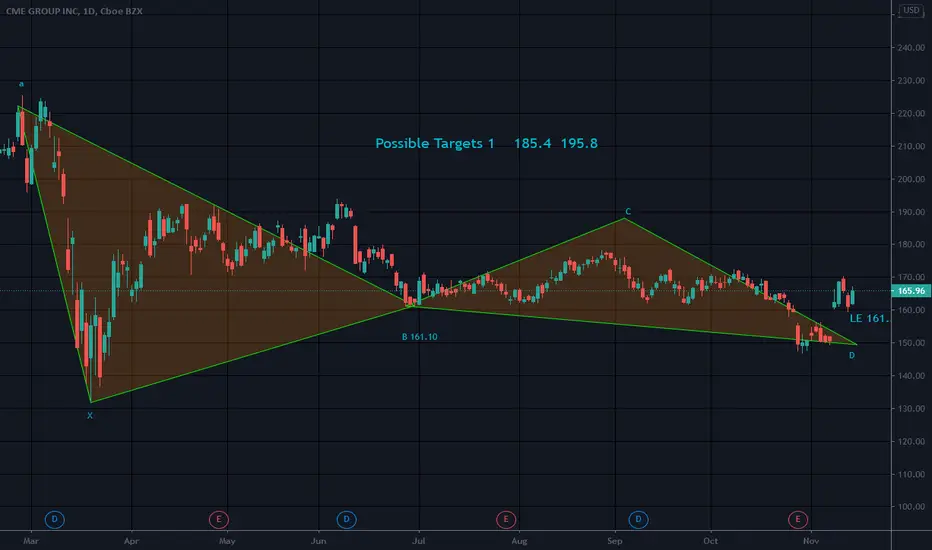
Like the ABC bullish pattern, this pattern helps to get in close to a bottom. There is an XA leg as well in the BB pattern
Just an observation
Trade ideas

CBOE-0.522*CME $CME CME Group vs. $CBOE CBOE Global Markets Inc Quantamental Tools for Proprietary and Retail Investors.
Statistical Arbitrage Opportunities Delivered to Your Inbox.
QuantChart. io
Long 1000 $CBOE
Short 522 $CME
Mean Reversion Time: 6 Trading Days


$CME looking good here for another retest👀possible 161 before friday
dont mind me just charting enjoy:)

Symmetric Triangle Falling WedgeFalling wedges are often bullish is at the bottom and can signal a reversal. I placed the level that needs to be broken. I do not see a clear uptrend yet
A clean break up from both patterns upper trendlines with an uptrend intact would be break out from these patterns.
Not a recommendation
Trade safely


CME - (BULLISH - S/T) (BEARISH - L/T) Below: 200 Day (yrly chart)
Below: 50 Day (yrly chart)
Below: 20 Day (yrly chart)
BULLISH Price: $170
BEARISH Price: $155

Falling Wedge Can be Bullish and May Signal a Trend ReversalTough one Earnings are 7-30 BMO
Rising wedges are often bearish
Falling wedges are often bullish and can signal a reversal
If a reversal does indeed happen/Targets would possibly be 202 225 233
Not a recommendation

CME Long 184.66 -> 206,9 / Stop: 178.21Short-term trade idea for NASDAQ:CME :
Long 184.66 -> 206,9 / Stop: 178.21
Profit: 12%, Risk: 3%, Risk ratio = 1/4
Size: 5% of portfolio
Idea based on triangle pattern
Stay tuned with more ideas and market signals with our Telegram-bot.

CME prepare to Long, double bottom updated planReplace yesterday's CME plan by this.
Existing condition:
1. Weekly demand zone confirmed
2. 60 min Chart double bottom formed
Plan A: If open near today's close
Buy below 142
Stop: 131
target: 185
Risk/reward=1:4
Plan B: If open Gap up (G1) break trendline
Buy at open (Better under 150)
Stop: 143 -- If it is breakaway Gap, it should not pull back under the trendline.
target: 185
Risk/reward=1:5
This stock is not good in Option: Bid/ask too big.
This is a trading school homework. I need 6 months to practice trading plan.
If you like it, thank you for your support. Please use SIM/Demo account to try it, until my trading plans get high winning rate.
Sum of my ideas: 1 winner, 1 loser, 4 active, 8 cancelled, 3 pending for condition, 1 analysis only.

CME Group (CME) long.All description on the chart.
Please, don't forget to like and follow.
Thank you.

CME - Bullish on push above the 618CME - Bullish on push above the 618
CME - Bullish on push above the 618 @187.72
I will be buying July or August CALLS this am.
I will add to my position on a drop to lower band of the downtrend regression channel @172-170 if needed.
1st Target = 786fib @ 202
2nd Target = 222
This content is for informational and educational purposes only. This is not in any way, shape or form financial or trading advice.
Good luck, happy trading and stay chill,
2degreez

CME Upside Wedge Breakout 1) Bullish breakout from wedge that began forming Sep 19
2) Convergence of 10 EMA, 20 EMA and 50 MA with price consolidating above. Bullish divergence beginning 1.7.20 with 10 EMA crossing above 20 EMA, and 20 EMA above 50 MA
3) 50/200 MA cross June 2019 with a recent pullback in price to 200 MA
4) RSI trendline breakout with support on EMA (using a 15 period with 60 EMA)
Long @ 207.86


Swing Trade - CME- Fell through support back in March
- Rebounded to form a weak cup-and-handle
- Last week's price range narrowed; forming a edge
- Inside NR3 and NR7 combo
Plan
- Long if break above last week's high
- Duration: ~ 5 days

Short by put option from to weekly level support $86Short by put option from to weekly level support $86

CME prepare to Long, double bottom formedExisting condition:
1. Weekly demand zone confirmed
2. 60 min Chart double bottom formed
Buy above 158 and below 162
Stop: 155
target: 185
Risk/reward=1:3
This stock is not good in Option: Bid/ask too big.
This is a trading school homework. I need 6 months to practice trading plan.
If you like it, thank you for your support. Please use SIM/Demo account to try it, until my trading plans get high winning rate.
Sum of my ideas: 1 winner, 1 loser, 1 active, 7 cancelled, 4 pending for condition, 1 analysis only.

buy only above 219.25 or sell only below 214.25buy only above 219.25
target 222.25
target 225.25
target 227.75
target 232.25
SL 215.55
or
sell only below 214.25
target 211.25
target 209.25
target 207.25
SL 216.55

BUY ONLY 219.25 OR SELL ONLY BELOW 213.25BUY ONLY 219.25
TARGET 225.25
TARGET 227.75
TARGET 230.25
sl 215.55
OR
SELL ONLY BELOW 213.25
TARGET 210.25.
TARGET 207.55
TARGET 203.25
SL: 215.75

Buy CME as hedge to volatilityCME tested its 200d MA and could represent a buying opportunity. We can also see some significant volume was exchanged b/w 200-210.
Moreover the CME usually benefits in times of hightened volatility. Given the broad market parabolic move, a hedge against the volatility is always welcome.


How brokers provide zero commission trading? You've probably heard of many zero commission trading platforms being established.
Robinhood is probably the most well known one, actually.
Historically, brokers have made their money by facilitating trades in the market between buyers and sellers and collected a fee for their extremely hard work...
Since markets have become larger, with greater trading volume and more participants, commissions per trade have fallen drastically, and the industry has had to change for your poor broker to earn a living.
With the rise of the smartphone, this has led to brokers being able to target a new type of trader...
This trader tends to be less informed than a professional...
Trading off a phone...
A lack of experience...
And more of a gambling mentality rather than understanding what is truly driving markets.
Firms have realised that.
'Commission free' is a marketing tool, and a very good one.
See, what is happening now is that market makers and dealers - and by extension, exchanges - are willing to pay brokers for their uninformed clients' order flow.
High frequency trading firms, such as Citadel, Apex, Renaissance, Virtu and DRW conduct market making on extremely low timeframes, providing liquidity to exchanges - that's their primary goal - and exchanges pay them rebates based on volume for doing so - note the chart of the CME Group above.
Their share price has increased massively since high frequency trading (market making) has driven 'liquidity' to the exchange.
Since their business is focused around volume, they welcome HFTs providing liquidity and therefore do not mind paying them volume based rebates - HFTs are kind of like introducing brokers.
But what's a market maker?
Market makers are delta neutral.
They do not necessarily care about the direction of a market, they simply want to sell higher at the bid and buy at a lower offer, thus capturing the 'spread' (the difference between the bid and the offer).
By paying brokers for the uninformed flow, this means that they believe they can capture asset misvaluations, and therefore turn a profit.
And it's very lucrative business.
Robinhood recently got fined for not routing orders adequately to allow for best execution for clients.
The adverse selection that they committed is an example of how a client can be at detriment.
However, it isn't necessarily bad to trade with a zero commission broker, since your explicit costs can be low (although implicit - the costs you don't see - could be higher and likely are).
What matters massively is their execution policy and whether you are being filled at the bid or offer that the market will allow you, or if you're receiving the price that the broker wishes you to get as part of their routing relationships with market makers.
The former is good, the latter is bad!
I hope that's cleared up a bit for you...
