Chicago Mercantile Exchange " Bell Curve Parabolic "The Chicago Mercantile Exchange,(CME)
the leading futures and options trading exchange in the United States
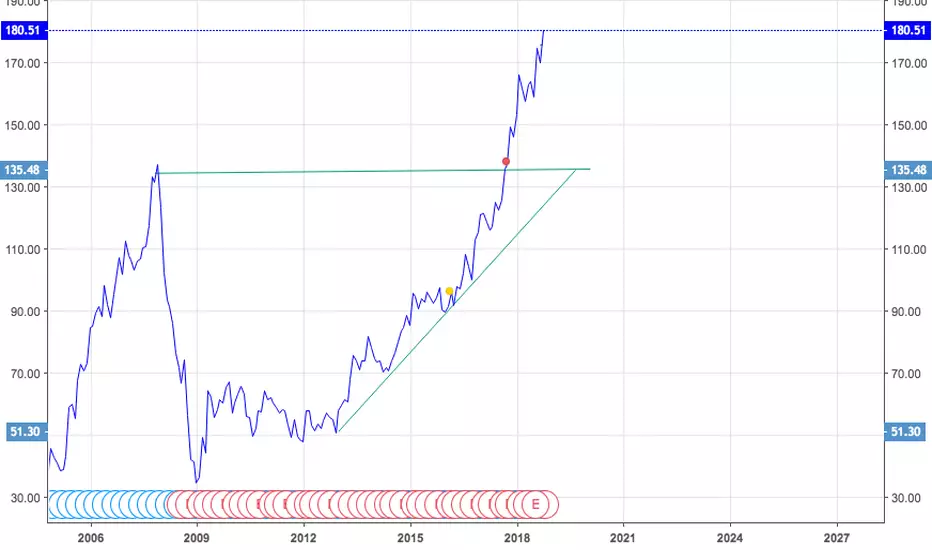
has seen it's stock rise 500%,...
during the last 7 years, from 40 in 2012, to a Close of 205.96 on 12/6/19
The stock as seen with the 3 Bar Indicator is currently in a "parabolic bell curve" advance,
that leaves very little margin for error on the downside.
You will note by the stock chart of CME that a stock in this kind of advance,corrects very little along the way.
CME is "anticipatory in nature, so it is always trading 6-9 months out in anticipation
and it continues to reinforce the strength, of the continuing bull market for stocks.
Keeping in mind that a stock in a parabolic advance can go a lot,lot further than most expect.
Traders should watch the $200 level in CME for important Support.
An very bullish upside target for CME to $400 a share,should not be ruled out,
due to the parabolic nature, of the 7 year ongoing advance
CME Last 205.96
THE_UNWIND
12/9/19
NEW YORK
Trade ideas


CME Triple Bottom with more room to run towards the upside. But there is a potential descending triangle that could mean more room to the downside. It is best to wait for either a break in the support, or a break in the downward trend before doing anything major in the stock.

CMEFollow me for my Buy & Sell signals!
"System T Performances: Annual Compound Profit 40%, Win Rate 55%, Risk Reward 2:1, 20 Years of Backtesting Data"


Wow ! CME "Micro" S+P 500 Future's Contract Launches Tonight Wow...This was news to me,
so I thought I would pass it on,
in case you hadn't already heard about it.
CME Group is launching " Micro" Futures on the S+P 500 tonight,
at 10% the value of the E Mini Contract, or just $5.00 per contract risk,
per 1 point move in the underlying contract.
CME is also launching "Micro" Futures Trading Contracts
on the Dow, and the Nasdaq 100 as well tonight.
I think this is going to be huge hit,
with retail traders across the board
with the lower margin requirements and less capital risk exposure,
And it might just put me back into trading S+P 500 Futures once again,
for the first time in many years.
More on this exciting CME product launch..soon.
THE_UNWIND
5/5/19
NEW YORK

Short CME to 160Fully formed head and shoulders patterns on the daily chart. The neckline was just recently broken as the 50 MA dropped below the 100 MA and is headed towards the 200 right now. We can also see bearish divergence forming on a downwards MACD cross. Stochastic RSI cross downwards as well. The price itself breached the 200 MA level of $175 as well. Looking super bearish here, and this is a stock that is less likely to be impacted by a "lavish" trade deal.

CME Group Announces All-Time Eurodollar Options Open Interest ReCME: CME Group
2019-03-18 09:00:00
CME Group Announces All-Time Eurodollar Options Open Interest Record of 55.8 Million Contracts - PR Newswire

CME Group $CME coiled bull wedge w/ Mar call OICME Group with a nice bull wedge that held strong at the key rising 55 week MA, and has some notable call open interest in March

CME jumping of supportEvery time CME hits support it races back to where it came from. Here CME even though in a downtrend confirms a jump of support line. Look for CME to hit 180 next week, but be weary of resistance could fall off a cliff again.

CME looks to bounce from the current support areaCME is likely to bounce back from support as it has happened 5 times in the past. 1st profit target is 181 and if it break this with strong volume, I think it will go much higher. stop loss is 174. I think this will be a good trade.


Short CME GroupBear wedge, been riding well above the longer term VWMA for awhile.
Volume is not what I'd usually look for, but I'm starting to doubt the importance of a particular volume pattern I look for.

CME: root for the villainTap dancing on the 10 EMA like W. Buffet on his way to work, CME is a longtime climber and Kevin Matras' favorite stock.


CME Group CME "Continuing Series; Stocks To Own" CME Group, CME, the worldwide leading derivative's exchange
for futures and options trading, made another new all time high this week.
Stocks that out-perform expectations,
thru "better than expected earnings and forward guidance,
are first tier stocks, and one's that you should consider for ownership.
Monthly Chart on CME shows a continuation move,
one that started with a move above140 resistance in 2007.
Point and Figure Price Objective can be measured up to 275,
and merits purchase,on any pull back towards 172 Support.
THE_UNWIND
ABC has just begun, in a descending wedge, short if possibleChart speaks for itself.
Buy in from 100 to 114, but this is definitely an overbought case, and should be shorted.
Don;t have any positions in this, just a TA.
/*This information is not a recommendation to buy or sell. It is to be used for educational purposes only.*/
If you want your coin to be analysed, please PM me.
Thank you,
Ajion

CME GROUP - V-top formedA chart pattern called V-Top is formed. They are very tricky to trade due to violent price movement. The 50, 20 & 9 EMAs are close and either the market is going a down trend or coming into consolidation.
***This is not an investment advice***
