Daily Market Update for 5/20Summary: A better-than-expected jobs report was enough to continue the trend in Technology and Communications stocks that started yesterday. Eyes remain on the Fed and inflation. Still, a drop in the US dollar and US treasury rates, in addition to lowering expectations from a few retailers, gave investors some relief that the economy was not overheating out of control.
Notes
Ideas always welcome in the comments. Errors will be amended as comments on TradingView or corrected inline in my blog.
-=x=-=x=-=x=-=x=-=x=-=x=-=x=-
Thursday, May 20, 2021
Facts: +1.77%, Volume lower, Closing range: 89% (w/gap), Body: 86%
Good: No lower wick, thick green body with high closing range
Bad: Lower volume
Highs/Lows: Higher high, higher low
Candle: Gap up at open, mostly green body with a short upper wick
Advanced/Decline: Three advancing stocks for every two declining stocks
Indexes: SPX (+1.06%), DJI (+0.55%), RUT (+0.64%), VIX (-6.81%)
Sectors: Technology (XLK +1.91%) and Communications (XLC +1.71%) were top. Financials (XLF +0.05%) and Energy (XLE -0.15%) were bottom.
Expectation: Higher
-=x=-=x=-=x=-=x=-=x=-=x=-=x=-
Market Overview
A better-than-expected jobs report was enough to continue the trend in Technology and Communications stocks that started yesterday. Eyes remain on the Fed and inflation. Still, a drop in the US dollar and US treasury rates, in addition to lowering expectations from a few retailers, gave investors some relief that the economy was not overheating out of control.
The Nasdaq closed the day with a +1.77% advance. Volume was lower, but the gap-up and higher high and higher low are both great signs. With the gap, the closing range was 89%. An 86% green body sits under a short upper wick formed late in the date. There is no visible lower wick. There were three advancing stocks for every two declining stocks.
The S&P 500 (SPX) gained +1.06%. The Dow Jones Industrial Average (DJI) advanced +0.55%. The Russell 2000 (RUT) gained +0.64%.
The VIX volatility index declined -6.81%.
Technology (XLK +1.91%) and Communications (XLC +1.71%) were the top sectors for the second day in a row. Only Energy (XLE -0.15%) declined for the day. Financials (XLF +0.05%) had a slight gain but was at the bottom of the sector list.
-=x=-=x=-=x=-=x=-=x=-=x=-=x=-
Economic Indicators
The US Dollar (DXY) declined -0.47% for the day.
The US 30y, 10y, and 2y Treasury yields all declined, and the spread between the 10y and 2y tightened.
Both High Yield Corporate Bond (HYG) and Investment Grade Corporate Bond (LQD) prices declined.
Silver (SILVER) and Gold (GOLD) advanced.
Crude Oil (CRUDEOIL1!) declined.
Timber (WOOD) advanced.
Copper (COPPER1!) and Aluminum (ALI1!) declined.
Bitcoin (BTCUSD) advanced +9.92%, recovering from yesterday's dip. Ethereum (ETHUSD) rose +14.48%.
-=x=-=x=-=x=-=x=-=x=-=x=-=x=-
Investor Sentiment
The put/call ratio dropped to 0.633. The put/call ratio (PCCE) is a contrarian indicator that shows overly bullish or overly bearish investor behavior. The 0.7 level is considered normal. As it approaches 0.60 (overly bullish) and below, watch for a possible pullback in the market.
The CNN Fear & Greed index is still in the fear zone.
The NAAIM money manager exposure index declined to 44.21
-=x=-=x=-=x=-=x=-=x=-=x=-=x=-
Market Leaders
All four largest mega-caps gained for the day. Apple (AAPL) rose +2.10% to close just below its 21d EMA and 50d MA lines. Alphabet (GOOGL) gained +1.56% and moved back above the 21d EMA. Microsoft (MSFT) closed just below the 50d MA, with a +1.38% gain. Amazon(AMZN) moved above the 50d MA with a +0.49% advance.
Tesla (TSLA) topped the mega-cap list for the first time in weeks. Nvidia (NVDA), Netflix (NFLX), ASML Holding (ASML), and PayPal (PYPL) were also at the top of the list with greater than 2.5% gains. Only a handful of mega-caps lost for the day. Bank of America (BAC), Exxon Mobil (XOM), Verizon (VZ), and United Health (UNH) were the worst losers of the day, but all declined less than 0.25%.
Enphase (ENPH) and Solar Edge (SEDG), two solar energy stocks, are at the top of the daily update growth list for the second day in a row. Fiverr (FVRR) and SNAP (SNAP) are the third and fourth best of the day. Several growth stocks topped 5% gains. Only a few in the list had losses. Those include DoorDash (DASH), Chewy (CHWY), RH (RH), and Palantir (PLTR) at the bottom of the list.
-=x=-=x=-=x=-=x=-=x=-=x=-=x=-
Looking ahead
On Friday morning, the Purchasing Manager Index data for Services and Manufacturing will be available after the market opens. The data shows an expected increase/decrease in activity to meet customer demand in the two sectors. Existing Home Sales will also be released after the market opens.
Deere & Company (DE), Foot Locker (FL), and Buckle (BKE) are on the shortlist of earnings reports for Friday.
-=x=-=x=-=x=-=x=-=x=-=x=-=x=-
Trends, Support, and Resistance
The index closed above the 21d EMA line today. It had first hit resistance at the line, then found support as the index faded a bit into the close. Holding this key support line is critical to ending the week positively.
The one-day trend-line points to a +0.97% gain for tomorrow, taking the index above the 50d MA.
The five-day trend line leads to a -0.85% loss.
The trend-line from the 4/2 high shows a -3.14% decline on Friday.
-=x=-=x=-=x=-=x=-=x=-=x=-=x=-
Wrap-up
I'll take it. A positive day for the Nasdaq, and growth stocks, and broad overall gains in the market is very welcome after a few days of disappointing losses. It's not yet time to jump back in the deep end. I would wait for a day with similar characteristics today, but higher volume showing institutions are accumulating.
Tomorrow is an options expiration day. Expect some changes in direction in the afternoon. Overall, I'll set my expectations for higher based on the past two days.
Stay healthy and trade safe!
IXIC trade ideas

Daily Market Update for 5/19Summary: You shake my nerves, and you rattle my brain! There is no question what investors worried about today. They took risk off the table at open ahead of the Fed minutes. Then morning comments from Fed member Quarles started to attract investors back in but at lowering volume. When the meeting minutes were released, volume popped back up as the market reacted.
Notes
Ideas always welcome in the comments. Errors will be amended as comments on TradingView or corrected inline in my blog.
-=x=-=x=-=x=-=x=-=x=-=x=-=x=-
Wednesday, May 19, 2021
Facts: -0.03%, Volume higher, Closing range: 2%, Body: 61%
Good: Thick green body shows buying after a gap down at open
Bad: Gap down at open
Highs/Lows: Lower high, lower low
Candle: All green body, barely visible upper and lower wicks
Advanced/Decline: Two declining stocks for every advancing stock
Indexes: SPX (-0.29%), DJI (-0.48%), RUT (-0.78%), VIX (+3.94%)
Sectors: Technology (XLK +0.35%) and Communications (XLC +0.16%) were top. Materials (XLB -1.53%) and Energy (XLE -2.49%)
Expectation: Sideways or Higher
-=x=-=x=-=x=-=x=-=x=-=x=-=x=-
Market Overview
You shake my nerves, and you rattle my brain! There is no question what investors worried about today. They took risk off the table at open ahead of the Fed minutes. Then morning comments from Fed member Quarles started to attract investors back in but at lowering volume. When the meeting minutes were released, volume popped back up as the market reacted.
Here is the intraday volume on the QQQ ETF before and after the Fed minutes were released:
The Nasdaq closed with a -0.03% loss, much better than the -1.71% dip at open. Volume was higher than the previous day. The 95% green body and 98% closing range shows the buying throughout the day. There is the potential, as with 5/11, that the gap down caused some shorts to cover and take profits. But much of the action seemed to be centered around the 2 pm release of the Fed minutes. There were two declining stocks for every advancing stock.
The Russell 2000 (RUT) had the worst performance of the day with a -0.78% decline. The Dow Jones Industrial Average (DJI) declined -0.48%. The S&P 500 (SPX) closed the day with a -0.29% loss.
The VIX volatility index rose another +3.94% but recovered from a 22% intraday spike.
Technology (XLK +0.35%) and Communications (XLC +0.16%) were the only gaining sectors for the day. Materials (XLB -1.53%) and Energy (XLE -2.49%) were the bottom two sectors. It's interesting to note that Utilities (XLU) and Consumer Staples (XLP) led in the early morning before the major indices pivoted upward.
-=x=-=x=-=x=-=x=-=x=-=x=-=x=-
Economic Indicators
The US Dollar (DXY) advanced +0.44% for the day.
The US 30y, 10y, and 2y Treasury yields all rose for the day, having dropped in the early morning hours but then climbing again after the Fed minutes were released.
Both High Yield Corporate Bond (HYG) prices and Investment Grade Corporate Bond (LQD) prices declined.
Silver (SILVER) declined, and Gold (GOLD) was flat.
Crude Oil (CRUDEOIL1!) declined. Timber (WOOD) declined.
Copper (COPPER1!) and Aluminum (ALI1!) declined.
Bitcoin (BTCUSD) dropped nearly -30% in the morning before recording to around a -11% decline at the time of writing. Ethereum (ETHUSD) was down -45% and is now around a -23.5% loss for the day.
-=x=-=x=-=x=-=x=-=x=-=x=-=x=-
Investor Sentiment
The put/call ratio rose to 0.806. The put/call ratio (PCCE) is a contrarian indicator that shows overly bullish or overly bearish investor behavior. The 0.7 level is considered normal. As it approaches 0.60 (overly bullish) and below, watch for a possible pullback in the market.
The CNN Fear & Greed index is still in the fear zone.
-=x=-=x=-=x=-=x=-=x=-=x=-=x=-
Market Leaders
Alphabet (GOOGL) was able to recover from the morning dip and end the day with a +0.40% gain. Microsoft (MSFT) ended with a slight gain of +0.02%. Amazon (AMZN) lost -0.01% and Apple (AAPL) declined -0.13%. The latter three are all trading below their 21d EMA and 50d MA lines. Alphabet is above its 50d MA but below its 21d EMA.
Salesforce (CRM) topped the mega-cap list with a +3.27% gain. Taiwan Semiconductor (TSM), Facebook (FB), and Intel (INTC) were also at the top of the list, with around 1% gains each. Tesla (TSLA), Exxon Mobil (XOM), AT&T (T), and Nike (NKE) were at the bottom of the list.
Enphase (ENPH) and Solar Edge (SEDG), two solar energy stocks, topped the daily update growth list with greater than 5% gains. Snowflake (SNOW) and Zynga (ZNGA) also were near the top of the list. CloudFlare (NET), Palantir (PLTR), and Ehang Holdings (EH) were at the bottom of the list.
-=x=-=x=-=x=-=x=-=x=-=x=-=x=-
Looking ahead
Initial Jobless Claims and the Philadelphia Fed Manufacturing Index data will be released Thursday.
Earnings Reports include Tencent (TCEHY), Applied Materials (AMAT), Ross Stores (ROST), and Deckers Outdoor (DECK).
-=x=-=x=-=x=-=x=-=x=-=x=-=x=-
Trends, Support, and Resistance
The index recovered from the morning gap down but remained well below the key moving average lines.
The early morning to afternoon gains created an upward sloping one-day trend-line that points to a +1.09% gain for tomorrow.
The five-day trend line leads to a +0.46% gain.
The trend-line from the 4/2 high shows a -1.89% decline on Thursday.
-=x=-=x=-=x=-=x=-=x=-=x=-=x=-
Wrap-up
Worries about the Fed's reaction to inflation don't seem to go away, and today it was on display as trading volume shrank considerably as investors awaiting the release of the minutes from last month's Fed meeting. The minutes did mention the possibility of unwelcome inflation, which suggests some reaction from the Fed. But still, the overwhelming comments say that any tapering now of treasury buybacks could stunt the economic recovery.
The index was choppy after the 2p release of the minutes, but volume popped up higher as investors consumed the new data. In the end, investors bought back into some riskier assets, sending big tech in the Technology and Communications sectors higher for the day. Cryptocurrencies recovered some of the morning losses. Treasury yields rose as investors sold the safe-haven asset.
Stay healthy and trade safe!

Daily Market Update for 5/18Summary: Surprisingly robust earnings reports from big retail before market open sent major indices on a rally in the morning. Still, the bullish exuberance couldn't hold on, and the indices closed the day with losses. Despite the downward pressure on the indexes, the growth stock list had a relatively good day.
Notes
Ideas always welcome in the comments. Errors will be amended as comments on TradingView or corrected inline in my blog.
-=x=-=x=-=x=-=x=-=x=-=x=-=x=-
Tuesday, May 18, 2021
Facts: -0.56%, Volume higher, Closing range: 2%, Body: 61%
Good: Higher high, higher low
Bad: Couldn't hold morning rally, closed day at low
Highs/Lows: Higher high, higher low
Candle: Red body under a long upper wick and almost no lower wick
Advanced/Decline: More declining stocks than advancing stocks
Indexes: SPX (-0.85%), DJI (-0.78%), RUT (-0.73%), VIX (+8.22%)
Sectors: Real Estate (XLRE +0.19%) and Health (XLV +0.03%) were top. Industrials (XLI -1.46%) and Energy (XLE -2.32%) were bottom.
Expectation: Sideways or Lower
-=x=-=x=-=x=-=x=-=x=-=x=-=x=-
Market Overview
Surprisingly robust earnings reports from big retail before market open sent major indices on a rally in the morning. Still, the bullish exuberance couldn't hold on, and the indices closed the day with losses. Despite the downward pressure on the indexes, the growth stock list had a relatively good day.
The Nasdaq closed with a -0.56% loss for the day but was able to turn in a higher high and higher low than the previous day. The index rose in the early morning but then fell the rest of the day, creating an upper wick in the morning but ending the day with a 2% closing range underneath a 61% red body. Volume was higher for the day, with intraday volume more elevated in the morning than in the afternoon. There were more declining stocks than advancing stocks.
The S&P 500 (SPX) led the losses for the day, declining -0.85%. The Dow Jones Industrial Average (DJI) fell -0.78%. The Russell 2000 (RUT) declined -0.73%.
The VIX volatility index rose another +8.22%.
Real Estate (XLRE +0.19%) and Health (XLV +0.03%) were the only sectors to gain for the day. Industrials (XLI -1.46%) and Energy (XLE -2.32%) were the bottom sectors. Energy continued last week's pattern of flip-flopping from top to bottom of the sector list.
-=x=-=x=-=x=-=x=-=x=-=x=-=x=-
Economic Indicators
The US Dollar (DXY) declined -0.45%. The index compares the USD against other major currencies. While the US economy recovers, expect investors to load up on currencies in markets expected to rebound soon as they transition out of lockdowns and back into fully open economies.
The US 30y, 10y, and 2y Treasury yields all declined slightly.
Both High Yield Corporate Bond (HYG) prices and Investment Grade Corporate Bond (LQD) prices declined.
Silver (SILVER) declined, and Gold (GOLD) advanced. Crude Oil (CRUDEOIL1!) declined. Timber (WOOD) declined.
Copper (COPPER1!) stayed flat while Aluminum (ALI1!) declined.
-=x=-=x=-=x=-=x=-=x=-=x=-=x=-
Investor Sentiment
The put/call ratio rose to 0.595. The put/call ratio (PCCE) is a contrarian indicator that shows overly bullish or overly bearish investor behavior. The 0.7 level is considered normal. As it approaches 0.60 (overly bullish) and below, watch for a possible pullback in the market.
The CNN Fear & Greed index is still in the fear zone.
-=x=-=x=-=x=-=x=-=x=-=x=-=x=-
Market Leaders
All four largest mega-caps declined. Amazon (AMZN) lost -1.17%, closing right at its 50d MA. Alphabet (GOOGL) declined -1.16%, closing just below the 21d EMA. Apple (AAPL) continues trading below both moving average lines, declining -1.12% today. Microsoft (MSFT) faired the best, only losing -0.86% today but still closing below both moving average lines.
Walmart (WMT) topped the mega-cap list with a +2.17% gain after surprising investors with better than expected earnings in their release before the market open. Retailer Alibaba (BABA) was the second-best mega-cap with a +1.27% gain. Toyota Motor Company (TM ) and Taiwan Semiconductor (TSM) round out the top four. At the bottom of the list were AT&T (T), Chevron (CVX), Exxon Mobil (XOM), and Facebook (FB).
Other retail reports were also positive, including Home Depot (HD). However, a lack of optimistic guidance and a dismal housing starts report put a damper on the positive report.
More than half of the daily update growth stock list had gains today. Ehang Holdings (EH), Sumo Digital (SUMO), Snowflake (SNOW), and Crowdstrike (CRWD) were the top gainers for the day. Dr Horton (DHI) was at the bottom of the list with nearly a 4% decline after the housing starts report. GrowGeneration (GRWG), Facebook, Workday (WDAY) were also at the bottom of the growth list, all with more than 1% losses.
-=x=-=x=-=x=-=x=-=x=-=x=-=x=-
Looking ahead
Crude Oil Inventories get an update on Wednesday. In the afternoon, FOMC member Bostic speaks, and the FOMC Meeting Minutes will be released. Investors will look closely for wording that shows concern over inflation and any hints toward monetary policy changes.
Cisco (CSCO), Lowe's (LOW), JD.com (JD), Target (TGT), TJX (TJX), Synopsys (SNPS), Vipshop (VIPS), and FUTU Holdings (FUTU) report earnings.
-=x=-=x=-=x=-=x=-=x=-=x=-=x=-
Trends, Support, and Resistance
The index attempted to rally toward the key moving average lines but faded late in the morning to close lower. The 21d EMA moved below the 50d MA, marking the downward trend.
The five-day trend-line points to a +1.83% gain tomorrow.
The one-day trend-line would result in a sideways move, with a slight -0.10% decline.
The trend-line from the 4/2 high shows a -1.71% decline on Wednesday.
-=x=-=x=-=x=-=x=-=x=-=x=-=x=-
Wrap-up
So far this week, we have a mix of signals. The higher high and higher low today are good after yesterday's indecisive candle. However, they fade from the morning rally, and a low closing range on higher volume shows much caution among investors.
The defensive sectors leading for the day adds to the signal of caution. Maybe the positive retail earnings reports are just creating more fear that the economy is overheating. On the other hand, growth stocks fared pretty well in the market today. That could be from the declining US Dollar. However, I'd expect big tech might benefit from a declining US dollar as well, and we did not see that today.
It could be that growth stocks declined so much that investors are just putting money into what they see as the bottom prices. Most of the growth stocks in the daily update list are down 50% or more from their 52-week highs. If investors see a bottom for growth stocks, it is time for a rotation from value back into growth. But expect any movement to be volatile as the market still watches inflation and the Fed very closely.
Stay healthy and trade safe!


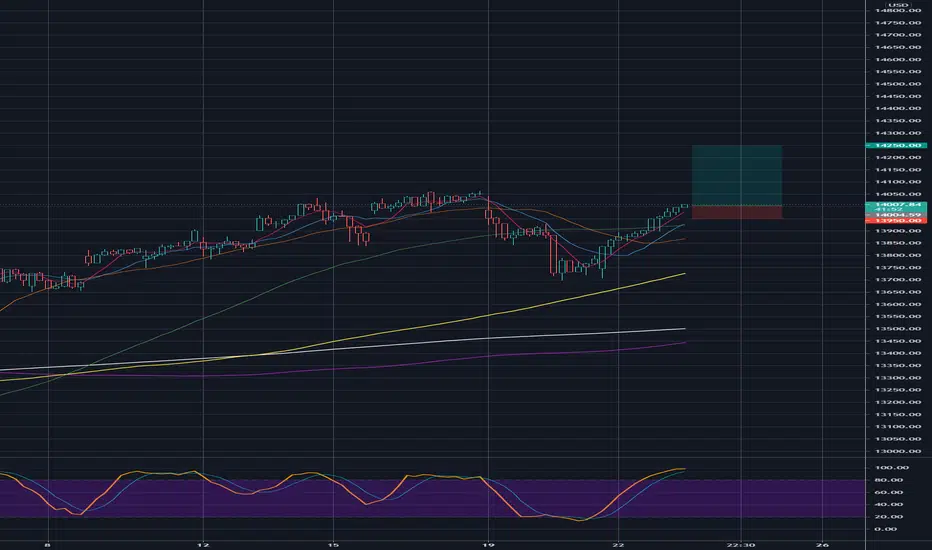
Harmonic patternHarmonic pattern suggest a bullish outcome.
The NASDAQ may be wedging into a breakout.

Daily Market Update for 5/17Summary: Monday started with a dip, just like the past several Mondays. This week's difference is that the bulls entered in the afternoon, bringing the major indices back to near their open. Small Caps performed best on the day as inflation still weighed on big tech and mid-cap growth.
Notes
Ideas always welcome in the comments. Errors will be amended as comments on TradingView or corrected inline in my blog.
-=x=-=x=-=x=-=x=-=x=-=x=-=x=-
Monday, May 17, 2021
Facts: -0.38%, Volume lower, Closing range: 85%, Body: 8%
Good: Close in upper part of range, bulls took over in afternoon
Bad: Lower high, selling most of day
Highs/Lows: Lower high, higher low
Candle: Tiny thin body over a long lower wick.
Advanced/Decline: More declining stocks than advancing stocks
Indexes: SPX (-0.25%), DJI (-0.16%), RUT (+0.11%), VIX (+4.84%)
Sectors: Energy (XLE +2.32%) and Materials (XLB +0.88%) were top. Communications (XLC -0.79%) and Utilities (XLU -0.82%) were bottom.
Expectation: Sideways or Higher
-=x=-=x=-=x=-=x=-=x=-=x=-=x=-
Market Overview
Monday started with a dip, just like the past several Mondays. This week's difference is that the bulls entered in the afternoon, bringing the major indices back to near their open. Small Caps performed best on the day as inflation still weighed on big tech and mid-cap growth.
The Nasdaq closed with a -0.38% loss on lower volume. The 85% closing range over an 8% green body is in the upper part of the candle over a long lower wick. The candle indicates the bulls weren't willing to let go, but still, there was indecision in the market. There were more declining stocks than advancing stocks.
The Russell 2000 (RUT) performed the best for the day, closing with a +0.11% gain. The S&P 500 (SPX) declined -0.25%, and the Dow Jones Industrial Average (DJI) lost -0.16%.
The VIX volatility index advanced +4.84%.
The Energy sector (XLE) led for another day, advancing +2.32%. Materials (XLB) was the second-best sector with a +0.88%. 7 of the 11 sectors declined, with Communications (XLC) and Utilities (XLU) at the bottom of the list with -0.79% and -0.82% declines.
-=x=-=x=-=x=-=x=-=x=-=x=-=x=-
Economic Indicators
The US Dollar (DXY) declined -0.12%.
The US 30y, 10y, and 2y Treasury yields all advanced for the day.
Both High Yield Corporate Bond (HYG) prices and Investment Grade Corporate Bond (LQD) prices declined.
Silver (SILVER) and Gold (GOLD) advanced. Crude Oil (CRUDEOIL1!) advanced. Timber (WOOD) declined.
Copper (COPPER1!) and Aluminum (ALI1!) advanced.
-=x=-=x=-=x=-=x=-=x=-=x=-=x=-
Investor Sentiment
The put/call ratio rose to 0.676. The put/call ratio (PCCE) is a contrarian indicator that shows overly bullish or overly bearish investor behavior. The 0.7 level is considered normal. As it approaches 0.60 (overly bullish) and below, watch for a possible pullback in the market.
The CNN Fear & Greed index is still in the fear zone.
-=x=-=x=-=x=-=x=-=x=-=x=-=x=-
Market Leaders
Amazon (AMZN) and Alphabet (GOOGL) advanced while Apple (AAPL) and Microsoft (MSFT) declined. Amazon rose +1.47% and closed above its 50d MA. Alphabet gained +0.46% and closed above its 21 EMA. Apple and Microsoft both closed below their 50d MA, with -0.93% and -1.20% declines.
The top mega-caps for the day were Exxon Mobil (XOM), Merck & Co (MRK), Toyota Motor (TM ), and Amazon. The majority of mega-caps were down, with Comcast (CMCSA), AT&T (T), Taiwan Semiconductor (TSM), and Tesla (TSLA) at the bottom of the list.
There were growth stocks that did well while others did not, perhaps depending on their sector. Lemonade (LMND), Chewy (CHWY), FUTU Holdings (FUTU), and Palantir (PLTR) were the top four. At the bottom of the list were Peloton (PTON), DraftKings (DKNG), RH (RH), and Square (SQ).
-=x=-=x=-=x=-=x=-=x=-=x=-=x=-
Looking ahead
Building Permits and Housing Starts data will release on Tuesday. API Weekly Crude Oil Stock data will update after market close.
Earnings releases will include Walmart (WMT), Home Depot (HD), Sea (SE), Baidu (BIDU), Trip.com (TCOM), and Macy's (M).
-=x=-=x=-=x=-=x=-=x=-=x=-=x=-
Trends, Support, and Resistance
The index remained in about the same spot, below the 21d EMA and 50d MA lines and above the 13,000 support area.
The five-day trend-line points to a -0.24% decline for tomorrow. The one-day trend line is just below that, showing a -0.62% declined.
The trend-line from the 4/2 high shows a -2.55% decline on Tuesday.
-=x=-=x=-=x=-=x=-=x=-=x=-=x=-
Wrap-up
Tax day was mostly uneventful. The indexes dropped buy then caught support, and the bulls bought back stocks at a discount into the late afternoon. The indecisive inside day means we'll have to wait until tomorrow for confirmation on a direction. The expectation is for sideways or higher, but the market could decide to go lower before it goes higher.
Stay healthy and trade safe!

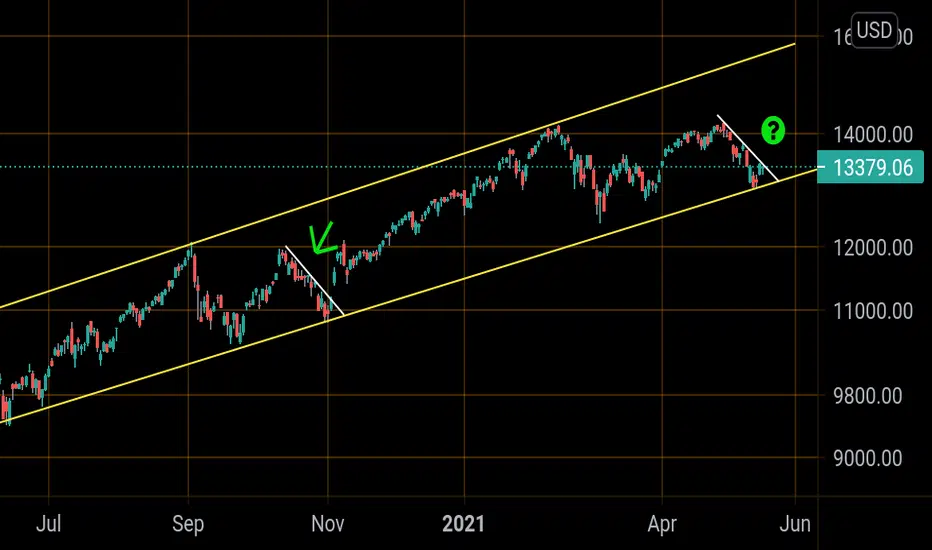
Nasdaq update Breakout was rejected on downtrend. There's really no more room for attempts , we either breakout to fall back to bottom of channel which coincides with fib support at 13091. I highlighted with green arrow the last breakout which h was back in November after Bidens election win. The election was the catalyst for huge volume to breakout. Where is the catalyst going to come from this time for the much need volume?
Market Week in Review - 5/10/2021 - 5/14/2021Summary: The focus was all on inflation this week. The updated consumer price index numbers were due on Wednesday, and investors entered the week expected the worst. On top of inflation, an oil pipeline closure on the east coast meant even more upward price pressure for consumers. Monday started the week with a terrible-looking marubozu candle which has no upper or lower wick. Prices went straight down from open to close. Utilities was the leading sector as investors took defensive positions. Five stocks declined for every advancing stock.
Notes
The Market Week in Review is my weekend homework where I look over what happened in the previous week and what might come in the next week.
I occasionally have some errors or typos and will correct them in my blog or the comments on TradingView. I do not have an editor and do this in my free time.
If you find this helpful, please let me know in the comments. I am also more than happy to add new perspectives and data points if you have ideas.
The structure is the following:
A recap of the daily updates that I do here on TradingView.
The Meaning of Life, a view on the past week
What's coming in the next week
The Bullish View, The Bearish View
Key index levels to watch out for
Wrap-up
If you have been following my daily updates, you can skip down to "The Meaning of Life." If not, then this first part is a great play-by-play recap for the week. Click the daily charts for more detail on sectors, indexes, and market leaders each day.
-=x=-=x=-=x=-=x=-=x=-=x=-=x=-
Monday, May 10, 2021
Facts: -2.55%, Volume higher, Closing range: 0%, Body: 100%
Good: Nothing
Bad: All red body, selling from open to close with a failed rally of the 50d MA
Highs/Lows: Lower high, lower low
Candle: Marubozu red, no upper or lower wick
Advance/Decline: Two declining stocks for every advancing stock
Indexes: SPX (+0.74%), DJI (+0.66%), RUT (+1.35%), VIX (-9.24%)
Sectors: Utilities (XLU +1.01%) and Consumer Staples (XLP +0.76%) were top. Communications (XLC -1.92%) and Technology (XLK -2.52%).
Expectation: Lower
Inflation looms over big tech and growth stocks like an approaching hurricane, keeping investors wondering when and how big it will hit. Last week's jobs data supported the government's case that there is still support needed for economic recovery and that inflation is transitionary. But a shutdown oil pipeline over the weekend has investors worried. And the future updates on consumer and producer price index data are causing them to take a cautious stance.
The result was a big hit to big tech and growth stocks as the Nasdaq closed with a -2.55% decline on higher volume. The ominous marubozu candle has no upper and lower wick. It is 100% red body with a 0% closing range.
This high of the day was the open, and the low of the day was the close. There was a brief rally as the index hit the 50d moving average, but it was short-lived and failed to send the index below the key support line. Five stocks declined for every advancing stock.
-=x=-=x=-=x=-=x=-=x=-=x=-=x=-
Tuesday, May 11, 2021
Facts: -0.09%, Volume lower, Closing range: 89%, Body: 87%
Good: Solid green body as bulls take over after gap down
Bad: Lower high, lower low, lower close
Highs/Lows: Lower high, lower low
Candle: Thick green body with short upper wick and high closing range
Advance/Decline: Two declining stocks for every advancing stock
Indexes: SPX (-0.87%), DJI (-1.36%), RUT (-0.26%), VIX (+11.09%)
Sectors: Materials (XLB +0.33%) and Communications (XLC -0.29%) were top. Financials (XLF -1.77%) and Energy (XLE -2.57%) were bottom.
Expectation: Sideways or Lower
A gap down must have shocked the bulls into action as the major indices crawled their way back up from morning lows. The results show a rotation happened underneath a market sell-off. Growth stocks benefited from the rotation, while the broader market had more than two declining stocks for every advancing stock.
The Nasdaq closed down -0.09% on lower volume. Despite a thick green-bodied candle, the lower high, lower low, and lower close continue a downtrend that's in its ninth day. The body covers 87% of the candle with a closing range of 89% under a thin upper wick. Two stocks declined for every advancing stock.
-=x=-=x=-=x=-=x=-=x=-=x=-=x=-
Wednesday, May 12, 2021
Facts: -2.67%, Volume lower, Closing range: 10%, Body: 64%
Good: Nothing
Bad: Lower high, lower low, lower close, all day selling
Highs/Lows: Lower high, lower low
Candle: Longer upper wick over a tick red body, tiny lower wick
Advance/Decline: Five declining stocks for every advancing stock
Indexes: SPX (-2.14%), DJI (-1.99%), RUT (-3.26%), VIX (+26.33%)
Sectors: Energy (XLE +0.48%) and Health (XLV -0.94%) were top. Technology (XLK -2.81%) and Consumer Discretionary (XLY -3.39%) were bottom.
Expectation: Sideways or Lower
Consumer price index data was higher than expected, which is excellent for the US dollar, but sent investors into a selling frenzy as they reacted to higher inflation and the possibility of higher interest rates. It's a conflicting mix of being glad the economy is recovering and trying to price in the impact to valuations and potential reactions by the Fed to an overheated economy.
The Nasdaq closed down -2.67% on the fourth day in a row of lower highs, lower lows, and lower closes. The closing range of 10% comes underneath a 64% red body, and a long upper wick formed in a quick but short-lived rebound at open. The selling pressure existed throughout the day as five stocks declined for every advancing stock.
-=x=-=x=-=x=-=x=-=x=-=x=-=x=-
Thursday, May 13, 2021
Facts: +0.72%, Volume lower, Closing range: 49%, Body: 11%
Good: Higher close, support at 13,000
Bad: Negative red body, indecisive after swings up and down intraday on lower volume
Highs/Lows: Lower high, higher low
Candle: Spinning top, inside day with a thin red body and long upper and lower wicks
Advance/Decline: More declining stocks than advancing stocks
Indexes: SPX (+1.22%), DJI (+1.29%), RUT (+1.68%), VIX (-16.17%)
Sectors: Utilities (+1.93%) and Industrial (XLI +1.87%) were top. Consumer Discretionary (XLY +0.71%) and Energy (XLE -1.22%) were bottom.
Expectation: Sideways or Lower
Buy the dip? That seems to be what drove prices higher today on optimism after a positive jobs report. But caution is still in the market with Utilities as the leading sector, growth stocks essentially not participating, and an advance/decline ratio still below 1.0.
The Nasdaq closed higher but on lower volume, advancing +0.72% for the day. The indecisive candle has a thin red body nearly in the middle of the long upper and lower wicks. The closing range is 49%, with a narrow 11% red body. There were more declining stocks than advancing stocks.
-=x=-=x=-=x=-=x=-=x=-=x=-=x=-
Friday, May 14, 2021
Facts: +2.32%, Volume lower, Closing range: 86%, Body: 80%
Good: Higher high, higher low, buying all day until just before close
Bad: Lower volume
Highs/Lows: Higher high, higher low
Candle: Thick green body under a small upper wick. Tiny lower wick.
Advanced/Decline: More than three advancing stocks for every declining stock
Indexes: SPX (+1.49%), DJI (+1.06%), RUT (+2.47%), VIX (-18.68%)
Sectors: Energy (XLE +3.10%) and Technology (XLK +2.20%) were top. Utilities (XLU +0.49%) and Consumer Staples (XLP +0.44%) were bottom.
Expectation: Sideways or Higher
A lighter volume but positive day followed lower than expected economic indicators, including Retail Sales and Consumer Sentiment. Perhaps the economic recovery is pausing as consumers react to the increases in prices. A little water on the fire could be good news to investors who are afraid things are overheating.
The Nasdaq closed with a +2.32% advance on lower volume. The thick green body over a tiny lower wick represents the buying throughout the day. A short upper wick came in the last hour of trading as investors took profits heading into the weekend. There were more than three advancing stocks for every declining stock.
-=x=-=x=-=x=-=x=-=x=-=x=-=x=-
The Meaning of Life (View on the Week)
The focus was all on inflation this week. The updated consumer price index numbers were due on Wednesday, and investors entered the week expected the worst. On top of inflation, an oil pipeline closure on the east coast meant even more upward price pressure for consumers. Monday started the week with a terrible-looking marubozu candle which has no upper or lower wick. Prices went straight down from open to close. Utilities was the leading sector as investors took defensive positions. Five stocks declined for every advancing stock.
Tuesday opened with a gap down and then a seemingly bullish day as the index climbed back to the previous day's close. What most likely happened was many shorts taking profits. Just as a gap up is usually following by profit-taking on long positions, a gap down will often cause shorts to buy back stocks to cover their positions and take profits. The exceptional performance of highly shorted growth stocks on Tuesday is evidence of the profit-taking.
Wednesday was inflation day. The consumer price index grew higher than expected, and it sent investors into a frenzy, causing the index to dip once more. For the second day this week, five stocks declined for every advancing stock.
As expected, the producer price index also came in higher than analyst expectations. But it seemed not as much of a surprise, and the index found a support level at 13,000, tested it mid-day, and then closed near the open. The inside day showed an indecisive market with reactions to better employment numbers, mixed with nervousness around the inflation impact. Utilities led the sector list again.
Then on Friday, an interesting thing happened. Economic data was worse than expected. Retail sales data for April went down instead of up, and Consumer Sentiment for May was lower than expected. But it seemed investors loved the news. It could be that inflation truly is temporary, as the Fed has been saying. Or at least it supported the idea that there is still more time needed before declaring a win for the economic recovery.
www.tradingview.com
The Nasdaq declined -2.34% for the week. The closing range of 62% shows the recovery on Thursday and Friday, bringing the index back into the upper half of the trading range. The candle is nearly identical to the previous week's candle, which had a similar sell-off in the first half of the week with some support in the latter part of the week.
All four major indices we track declined for the week. The Dow Jones Industrial Average (DJI) fell -1.14%. The S&P 500 (SPX) lost -1.39%. The Russell 2000 (RUT) dropped -2.07% but was down over 6% in the middle of the week.
The VIX volatility index spiked +73.34% during the week but ended the week with just a +12.7% gain.
It was a mix of defensive and cyclical stocks that led the sector list this week. Only three sectors ended the week with gains, while the high growth sectors took the most significant declines.
Consumer Staples ( XLP ) topped the list, with Utilities ( XLU ) in fourth place. Both are defensive sectors for investors. Real Estate ( XLRE ) was lower in the list but still outperformed the sectors.
Financials ( XLF ) and Materials ( XLB ) joined Consumer Staples as the only sectors to end the week with gains.
Technology ( XLK ) and Consumer Discretionary ( XLY ) were at the bottom of the list. Both contain high growth companies that are likely to be impacted by inflation and potential increases in interest rates. They started to recovery on Thursday and Friday after the US Dollar and Treasury interest rates dropped.
The US Treasury 30y, 10y, and 2y yields all rose for the week. The spreads widened a bit between long and short-term yields.
Both the High Yield Corporate Bond (HYG) prices and Investment Grade Bond (LQD) prices declined sharply in the middle of the week but recovered to end the week with a small loss.
The US Dollar (DXY) rose +0.67% on Wednesday but then retreated, ending the week with a +0.08% advance.
Silver (SILVER) declined -0.10% while Gold (GOLD) advanced +0.60%.
Crude Oil (CRUDEOIL1!) advanced +0.48%.
The material commodities pulled back from record highs.
Timber (WOOD) declined -2.81%.
Copper (COPPER1!) declined -1.71%.
Aluminum (ALI1!) declined -3.11%.
Investors seemed to rotate back and forth between growth and value this week.
-=x=-=x=-=x=-=x=-=x=-=x=-=x=-
The Big Four Mega-caps
The big four mega-caps continued to slide this week but outperformed the Nasdaq overall. Microsoft (MSFT) dipped below the 10w MA but closed above the line, losing only -1.71% for the week. Amazon (AMZN) lost -2.09%, closing below its 10w MA line. Apple (AAPL) dipped below its 10w and 40w MA but ended above both, closing the week with a -2.12% loss. Alphabet (GOOGL) was the only of the four to underperform the index, declining -3.13%. However, Alphabet stayed above the 10w moving average line.
-=x=-=x=-=x=-=x=-=x=-=x=-=x=-
The Four Recovery Stocks
I picked four recovery stocks to track against the indexes and other indicators in this weekly report. The results were mixed this week. Carnival Cruise Lines (CCL) gained +1.64% but remained below its 10w MA line after a weekly lower high and lower low. Delta Airlines (DAL) had a similar pattern but advanced only +0.43%. Marriot (MAR) declined -2.32%. Exxon Mobile (XOM) led energy stocks lower for the week, closing with a -2.66% weekly loss.
-=x=-=x=-=x=-=x=-=x=-=x=-=x=-
Cryptocurrency
I'll start tracking four major cryptocurrencies on the week in review. The four are Bitcoin, Ethereum, Litecoin, and Bitcoin Cash. The latter two are not the largest by market cap but seem to be well-known and are part of the CIX capital.com index, which is tracking five cryptocurrencies, including these four (Ripple is the fifth). Nothing to note at the moment other than Bitcoin is bouncing between 60,000 and support at around 49,000. Ethereum is pulling back slightly from a 70% rally over the past two weeks.
-=x=-=x=-=x=-=x=-=x=-=x=-=x=-
Investor Sentiment
The put/call ratio (PCCE) rose this week to its highest daily level since November. It recovered by the end of the week to end at 0.658. A contrarian indicator, when the put/call ratio is below 0.7, it signals overly bullish sentiment and could mean an overbought market.
The CNN Fear & Greed index is on the fear side but not yet approaching extreme fear.
The NAAIM money manager exposure index is at 46.86 after moving above 100 two weeks ago.
-=x=-=x=-=x=-=x=-=x=-=x=-=x=-
The Week Ahead
Monday
The week will open with Manufacturing data on Monday morning. Several FOMC members will speak after the market opens.
Tencent Music (TME), Niu Tech (NIU), Desktop Metal (DM), Fisker (FSR), Riot Blockchain (RIOT) will report earnings on Monday.
Tuesday
Building Permits and Housing Starts data will release on Tuesday. API Weekly Crude Oil Stock data will update after market close.
Earnings releases will include Walmart (WMT), Home Depot (HD), Sea (SE), Baidu (BIDU), Trip.com (TCOM), and Macy's (M).
Wednesday
Crude Oil Inventories get an update on Wednesday. In the afternoon, FOMC member Bostic speaks, and the FOMC Meeting Minutes will be released. Investors will look closely for wording that shows concern over inflation and any hints toward monetary policy changes.
Cisco (CSCO), Lowe's (LOW), JD.com (JD), Target (TGT), TJX (TJX), Synopsys (SNPS), Vipshop (VIPS), and FUTU Holdings (FUTU) report earnings.
Thursday
Initial Jobless Claims and the Philadelphia Fed Manufacturing Index data will be released Thursday.
Earnings Reports include Tencent (TCEHY), Applied Materials (AMAT), Ross Stores (ROST), and Deckers Outdoor (DECK).
Friday
On Friday morning, the Purchasing Manager Index data for Services and Manufacturing will be released just aftermarket open. The data shows an expected increase/decrease in activity to meet customer demand in the two sectors. Existing Home Sales will also be released after the market opens.
Deere & Company (DE), Foot Locker (FL), and Buckle (BKE) are on the shortlist of earnings reports for Friday.
-=x=-=x=-=x=-=x=-=x=-=x=-=x=-
The Bullish Side
Now that investors have a complete picture of inflation for the month, they can focus on other data points. They can focus on which sectors are performing well and which stocks have had good earnings results and show additional growth this year.
The lower-than-expected retail sales and consumer sentiment data on Friday poured a little water on the fire burning around inflation. That will provide some relief for investors overly worried about the impact of inflation and the prospect for higher interest rates.
As the dollar came back down in value after spiking on Wednesday, big tech and growth stocks found support and healthy gains. As the value trade deflates on lower retail and consumer sentiment data, growth stocks could benefit, boosting the Nasdaq. The could accelerate if investors decide now is the time to buy these stocks at a reduced price.
The Fed is still on our side.
-=x=-=x=-=x=-=x=-=x=-=x=-=x=-
The Bearish Side
The index lost several key support levels this past week and has much to prove before investor confidence returns. The put/call ratio remains higher than in recent months, showing investors are nervous about what's to come. That nervousness could mean we have not hit the bottom of this pull-back yet.
The increases in the index this past week came on lower volume. That could be because the gains were mainly coming from shorts covering positions vs. an actual bullish rally. If so, the support could be weak, and another leg lower may be in store.
The Fed can flip sides at any time.
-=x=-=x=-=x=-=x=-=x=-=x=-=x=-
Key Nasdaq Levels to Watch
The Nasdaq dropped below the 50d MA and found support at the 13,000 level. That 13,000 level is a crucial area to watch.
On the positive side, the levels are:
The 10d MA moved below the 21d EMA and 50d MA, marking the sudden drop. It's currently at 13,487.41 and the first critical level to reach.
The 50d MA is at 13,539.94.
The 21d EMA is at 13,598.43.
The high of this past week was 13,687.93.
The rally attempt of the previous week went to 13,828.62. Get above this level to end the sequence of lower highs.
14,000 has been a key area of support/resistance. The index has only stayed above this level for a few days at a time since the beginning of 2021.
The all-time high is at 14,211.57 is the all-time high.
On the downside, there are a few key levels:
The low of this past week is 13,002.54.
That low is just above the 13,000 support line.
12,786.81 is a low pivot point from the late March dip. Stay above this low to keep an upward trend since early March.
12,479.80 is the 200d MA.
12,397.05 is a low pivot point from the early March dip.
-=x=-=x=-=x=-=x=-=x=-=x=-=x=-
Wrap-up
The inflation storm hit this week, and it was a rough ride for growth investors. Thankfully, we found some support on Thursday and Friday and hope that the bulls are coming back in to buy stocks at a discount. The big question is whether all the news on an overheating economy is baked in now and the market will start to make another leg up. Or will the economic data continue to shake investors out of equities?
Good luck, stay healthy, and trade safe!

Daily Market Update for 5/14Summary: A lighter volume but positive day followed lower than expected economic indicators, including Retail Sales and Consumer Sentiment. Perhaps the economic recovery is pausing as consumers react to the increases in prices. A little water on the fire could be good news to investors who are afraid things are overheating.
Notes
Ideas always welcome in the comments. Errors will be amended as comments on TradingView or corrected inline in my blog.
-=x=-=x=-=x=-=x=-=x=-=x=-=x=-
Friday, May 14, 2021
Facts: +2.32%, Volume lower, Closing range: 86%, Body: 80%
Good: Higher high, higher low, buying all day until just before close
Bad: Lower volume
Highs/Lows: Higher high, higher low
Candle: Thick green body under a small upper wick. Tiny lower wick.
Advanced/Decline: More than three advancing stocks for every declining stock
Indexes: SPX (+1.49%), DJI (+1.06%), RUT (+2.47%), VIX (-18.68%)
Sectors: Energy (XLE +3.10%) and Technology (XLK +2.20%) were top. Utilities (XLU +0.49%) and Consumer Staples (XLP +0.44%) were bottom.
Expectation: Sideways or Higher
-=x=-=x=-=x=-=x=-=x=-=x=-=x=-
Market Overview
A lighter volume but positive day followed lower than expected economic indicators, including Retail Sales and Consumer Sentiment. Perhaps the economic recovery is pausing as consumers react to the increases in prices. A little water on the fire could be good news to investors who are afraid things are overheating.
The Nasdaq closed with a +2.32% advance on lower volume. The thick green body over a tiny lower wick represents the buying throughout the day. A short upper wick came in the last hour of trading as investors took profits heading into the weekend. There were more than three advancing stocks for every declining stock.
The major indices all did well for the day. The S&P 500 (SPX) advanced +1.49%. The Dow Jones Industrial Average (DJI) rose +1.06%. The Russell 2000 (RUT) was the best performing, ending the day with a +2.47% gain.
The VIX volatility index declined another -18.68%.
Flip-flopping from top to bottom throughout the week, the Energy sector (XLE +3.10%) is back on top Friday. Technology (XLK +2.20%) followed closely behind after losing ground through most of the week. All sectors gained for the day. Utilities (XLU +0.49%) and Consumer Staples (XLP +0.44%) were at the bottom of the list as investors focused on riskier assets.
-=x=-=x=-=x=-=x=-=x=-=x=-=x=-
Economic Indicators
The US Dollar (DXY) declined -0.46%.
The US 30y, 10y, and 2y Treasury yields all declined for a second day. The yield curve is flattening again after steepening earlier in the week.
Both High Yield Corporate Bond (HYG) prices and Investment Grade Corporate Bond (LQD) prices advanced for another day.
Silver (SILVER) and Gold (GOLD) advanced. Crude Oil (CRUDEOIL1!) advanced. Timber (WOOD) advanced.
Copper (COPPER1!) declined while Aluminum (ALI1!) advanced just slightly.
-=x=-=x=-=x=-=x=-=x=-=x=-=x=-
Investor Sentiment
The put/call ratio dropped to 0.658. The put/call ratio (PCCE) is a contrarian indicator that shows overly bullish or overly bearish investor behavior. The 0.7 level is considered normal. As it approaches 0.60 (overly bullish) and below, watch for a possible pullback in the market.
The CNN Fear & Greed index is still in the fear zone.
The NAAIM money manager exposure index is at 46.86 after moving above 100 two weeks ago.
-=x=-=x=-=x=-=x=-=x=-=x=-=x=-
Market Leaders
All four big mega-caps advanced. Apple (AAPL) and Microsoft (MSFT) both closed back above their 50d MA, gaining +1.98% and +2.11%, respectively. Alphabet (GOOGL) moved back above its 21d EMA, advancing +2.21%. Amazon (AMZN) closed just below the 50d MA, gaining +1.94%.
Topping the mega-cap list are Nvidia (NVDA), ASML Holding (ASML), Facebook (FB), and Taiwan Semiconductor (TSM).
The top four growth stocks all gained more than 10%. DoorDash (DASH) rose gained 20%. Chinese fintech firms UP Fintech (TIGR) and FUTU Holdings (FUTU) topped the list, with GrowGeneration (GRWG) and Snowflake (SNOW) rounding out the top five. Only one stock in the daily update list declined, Ehang Holdings (EH) lost -1.45. Hyre (HYRE) is not on the daily list but might need to be added, gaining 44.57% on a massive earnings beat.
-=x=-=x=-=x=-=x=-=x=-=x=-=x=-
Looking ahead
The week will open with Manufacturing data on Monday morning. Several FOMC members will speak after the market opens.
Tencent Music (TME), Niu Tech (NIU), Desktop Metal (DM), Fisker (FSR), Riot Blockchain (RIOT) will report earnings on Monday.
-=x=-=x=-=x=-=x=-=x=-=x=-=x=-
Trends, Support, and Resistance
The index made a move back toward the 50d moving average line today but couldn't quite make it that high on the lower volume.
If the one-day trend-line continues on Monday, it points to a +1.43% gain that takes the index back above both the 21d EMA and the 50d MA.
The five-day trend line leads to a -2.13% decline.
The trend-line from the 4/2 high shows a -2.88% decline on Monday.
-=x=-=x=-=x=-=x=-=x=-=x=-=x=-
Wrap-up
It's been a hectic week, and it feels good to have a few days over the weekend to take a deep breath. The gains on Thursday and Friday are a relief to see, but there is still much to prove. Going into next week, I want to see another move up, but on higher volume and continued breath across equities.
The lowered retail sales and consumer expectations may be just the thing investors needed to look away from inflation for a while. We'll take a closer look at this in the Week in Review.
Have a great weekend!
Stay healthy and trade safe!

Daily Market Update for 5/13Summary: Buy the dip? That seems to be what drove prices higher today on optimism after a positive jobs report. But caution is still in the market with Utilities as the leading sector, growth stocks essentially not participating, and an advance/decline ratio still below 1.0.
Notes
Ideas always welcome in the comments. Errors will be amended as comments on TradingView or corrected inline in my blog.
-=x=-=x=-=x=-=x=-=x=-=x=-=x=-
Thursday, May 13, 2021
Facts: +0.72%, Volume lower, Closing range: 49%, Body: 11%
Good: Higher close, support at 13,000
Bad: Negative red body, indecisive after swings up and down intraday on lower volume
Highs/Lows: Lower high, higher low
Candle: Spinning top, inside day with a thin red body and long upper and lower wicks
Advance/Decline: More declining stocks than advancing stocks
Indexes: SPX (+1.22%), DJI (+1.29%), RUT (+1.68%), VIX (-16.17%)
Sectors: Utilities (+1.93%) and Industrial (XLI +1.87%) were top. Consumer Discretionary (XLY +0.71%) and Energy (XLE -1.22%) were bottom.
Expectation: Sideways or Lower
-=x=-=x=-=x=-=x=-=x=-=x=-=x=-
Market Overview
Buy the dip? That seems to be what drove prices higher today on optimism after a positive jobs report. But caution is still in the market with Utilities as the leading sector, growth stocks essentially not participating, and an advance/decline ratio still below 1.0.
The Nasdaq closed higher but on lower volume, advancing +0.72% for the day. The indecisive candle has a thin red body nearly in the middle of the long upper and lower wicks. The closing range is 49%, with a narrow 11% red body. There were more declining stocks than advancing stocks.
The Russell 2000 (RUT) led the day among the major indices, with a +1.68% advance. The Dow Jones Industrial Average (DJI) advanced +1.29%. The S&P 500 (SPX) gained +1.22%. All four of our indices had inside days, with lower highs and higher lows.
The VIX volatility index retreated -16.17%.
Energy (XLE -1.22%) moved back to the bottom of the sector list, the only losing sector of the day. That comes after being the only gaining sector on Wednesday. Utilities (+1.93%) and Industrial (XLI +1.87%) were the top sectors for the day. The Utilities sector often tops the list when investors are taking defensive positions.
-=x=-=x=-=x=-=x=-=x=-=x=-=x=-
Economic Indicators
The US Dollar (DXY) declined -0.06%.
The US 30y, 10y, and 2y Treasury yields all declined for the day.
Both High Yield Corporate Bond (HYG) prices and Investment Grade Corporate Bond (LQD) prices advanced.
Silver (SILVER) and Gold (GOLD) advanced. Crude Oil (CRUDEOIL1!) declined. Timber (WOOD) advanced.
Copper (COPPER1!) and Aluminum (ALI1!) declined.
-=x=-=x=-=x=-=x=-=x=-=x=-=x=-
Investor Sentiment
The put/call ratio dropped to 0.760. The put/call ratio (PCCE) is a contrarian indicator that shows overly bullish or overly bearish investor behavior. The 0.7 level is considered normal. As it approaches 0.60 (overly bullish) and below, watch for a possible pullback in the market.
The CNN Fear & Greed index is still in the fear zone.
The NAAIM money manager exposure index dropped to 46.86 after moving above 100 two weeks ago.
-=x=-=x=-=x=-=x=-=x=-=x=-=x=-
Market Leaders
All four big mega-caps advanced. Apple (AAPL) rose +1.79%. Microsoft (MSFT) gained +1.69%. Amazon (AMZN) advanced +0.30%. All three neared their 50d MA but retreated from the line before close. Alphabet (GOOGL) rose +1.31% and is the only of the four big mega-caps to remain above the 50d MA.
ASML Holding (ASML), Home Depot (HD), JP Morgan (JPM), and Oracle (ORCL) were the top mega-caps of the day. At the bottom of the list were Alibaba (BABA), Tesla (TSLA), Exxon Mobil (XOM), and Nvidia (NVDA).
Growth stocks had a tough day. The ones that had gains included Lemonade (LMND), Peloton (PTON), DR Horton (DHI), and PayCom (PAYC). Fiverr (VFR), Sumo Logic (SUMO), JD.com (JD), and NIO (NIO) were at the bottom of the list.
-=x=-=x=-=x=-=x=-=x=-=x=-=x=-
Looking ahead
Friday brings an update to Core Retail Sales for April. Export/Import Price Index data will also be released. Closer to open, we will get updates on Industrial Production and Business Inventories data. Consumer Expectations and Consumer Sentiment numbers for May will come after the market open.
Another large round of Japanese earnings reports comes on Friday.
UP fintech (TIGR) will also report on Friday.
-=x=-=x=-=x=-=x=-=x=-=x=-=x=-
Trends, Support and Resistance
The Nasdaq tested the 13,000 area again and found support, closing above the area.
If the one-day trend-line and the trend-line from the 4/29 high continue, the index will decline -0.83% decline tomorrow.
The five-day trend line points to a -2.41% decline.
-=x=-=x=-=x=-=x=-=x=-=x=-=x=-
Wrap-up
Although the indexes ended the days with gains, the choppy ride and the low volume raise some alarms. Is this a pivot point to the upside or simply a pause on the way down? Indeed, there is good news in the jobs recovery, and we'll be likely to see increased retail sales tomorrow. But that may stoke more inflation fears and send investors further into defensive mode.
You could say that today was a positive expectation breaker since my expectation was for Sideways or Lower. Still, the inside day, thin red body and weak volume, plus the number of declining stocks, don't feel positive. So I'm still setting an expectation for sideways or lower tomorrow and waiting for the index to prove itself.
Stay healthy and trade safe!


Daily Market Update for 5/12Summary: Consumer price index data was higher than expected which is great for the US dollar, but sent investors into a selling frenzy as they reacted to higher inflation and the possibility of higher interest rates. It's a conflicting mix of being glad the economy is recovering, but also trying to price in the impact to valuations and potential reactions by the Fed to an overheated economy.
Notes
Ideas always welcome in the comments. Errors will be amended as comments on TradingView or corrected inline in my blog.
-=x=-=x=-=x=-=x=-=x=-=x=-=x=-
Wednesday, May 12, 2021
Facts: -2.67%, Volume lower, Closing range: 10%, Body: 64%
Good: Nothing
Bad: Lower high, lower low, lower close, all day selling
Highs/Lows: Lower high, lower low
Candle: Longer upper wick over a tick red body, tiny lower wick
Advance/Decline: Five declining stocks for every advancing stock
Indexes: SPX (-2.14%), DJI (-1.99%), RUT (-3.26%), VIX (+26.33%)
Sectors: Energy (XLE +0.48%) and Health (XLV -0.94%) were top. Technology (XLK -2.81%) and Consumer Discretionary (XLY -3.39%) were bottom.
Expectation: Sideways or Lower
-=x=-=x=-=x=-=x=-=x=-=x=-=x=-
Market Overview
Consumer price index data was higher than expected which is great for the US dollar, but sent investors into a selling frenzy as they reacted to higher inflation and the possibility of higher interest rates. It's a conflicting mix of being glad the economy is recovering, but also trying to price in the impact to valuations and potential reactions by the Fed to an overheated economy.
The Nasdaq closed down -2.67% on the fourth day in a row of lower highs, lower lows and lower closes. The closing range of 10% comes underneath a 64% red body and a long upper wick formed in a quick but short-lived rebound at open. The selling pressure existed throughout the day as give stocks declined for every advancing stock.
The Russell 2000 (RUT) took the worst hit for the day with a -3.26% decline. The S&P 500 (SPX) declined -2.14%. The Dow Jones Industrial average (DHI) lost -1.99%.
The VIX volatility index rose +26.33%.
In a flip from the previous day, Energy (XLE +0.48%) went from the bottom of the sector list to being the only sector to end today with a gain. Health (XLV -0.94%) was the next best sector even though losing almost 1% for the day.
Only Materials (XLB +0.33%) ended the day with gains while Communications (XLC -0.29%) was the second best sector. Financials (XLF -1.77%) and Energy (XLE -2.57%) moved the bottom of the sector list. Dominated by big tech and high growth companies that are impacted by inflation and higher interest rates, thhe Technology (XLK -2.81%) and Consumer Discretionary (XLY -3.39%) sectors were at the bottom of the list.
-=x=-=x=-=x=-=x=-=x=-=x=-=x=-
Economic Indicators
The US Dollar (DXY) advanced +0.67%.
The US 30y, 10y and 2y treasury yields all rose for the day and the yield curve steepened.
Both High Yield Corporate Bond (HYG) prices and Investment Grade Corporate Bond (LQD) prices declined.
Silver (SILVER) and Gold (GOLD) declined. Crude Oil (CRUDEOIL1!) advanced. Timber (WOOD) declined. Copper (COPPER1!) and Aluminum (ALI1!) declined.
-=x=-=x=-=x=-=x=-=x=-=x=-=x=-
Investor Sentiment
The put/call ratio rose slightly to 0.978. The put/call ratio (PCCE) is a contrarian indicator that shows overly bullish or overly bearish investor behavior. The 0.7 level is considered normal. As it approaches 0.60 (overly bullish) and below, watch for a possible pullback in the market.
The CNN Fear & Greed index moved well into the Fear side, but still short of Extreme Fear.
-=x=-=x=-=x=-=x=-=x=-=x=-=x=-
Market Leaders
All four big mega-caps declined. Only Alphabet (GOOGL) remains above its 50d moving average line, declining -3.08% today. Apple (AAPL) and Microsoft (MSFT) both lost -2.49%. Amazon (AMZN) declined -2.23%.
Only a few mega-caps had gains for the day, with Pfizer (PFE), Toyota Motor (TM ), Chevron (CVX) and Abbvie (ABBV) topping the list. ASML Holding (ASML), Tesla (TSLA), Home Depot (HD) and Nvidia (NVDA) were at the bottom of the list.
None of the daily update growth stocks had gains for the day. Best performing were Ehang Holdings (EH), Alibaba (BABA), Facebook (FB) and Sumo Logic (SUMO). At the bottom of the list was Fastly (FSLY), FUTU Holding (FUTU) and Lemonade (LMND), all with greater than 10% losses.
-=x=-=x=-=x=-=x=-=x=-=x=-=x=-
Looking ahead
Produce Price Index data will be released in the morning, which is a leading indicator to consumer prices and another input on inflation worries. The weekly update on Jobless Claims also comes in the morning.
Earnings Reports include Alibaba (BABA), Walt Disney (DIS), AirBnB (ABNB), Coinbase (COIN), DoorDash (DASH), Farfetch (FTCH), Celsius (CELH), and DermTech (DMTK).
-=x=-=x=-=x=-=x=-=x=-=x=-=x=-
Trends, Support and Resistance
The Nasdaq continues to retreat below the 50d moving average line. It closed today just above the 13,000 support line which was first acted as resistance in December, turned to a support area in January. The index dipped below the line twice since that time but then quickly moved back above.
Returning to the midpoint of the trend-line from the 4/29 high would result in a +0.72% advance.
The five-day trend line points to a -0.13% decline tomorrow, a relative sideways move.
The one-day trend, if it continues, would result in a -1.41% decline, busting through 13,000 support.
-=x=-=x=-=x=-=x=-=x=-=x=-=x=-
Wrap-up
I wrote yesterday that I hoped the worst of inflation was already priced in and possibly inflation would be less than expected or at least at expectation. Well the core consumer price index showed a worst picture than expected. After the data was released, flipping back to the pre-market QQQ chart was enough to tell you how the rest of the day would go. Red.
Tomorrow is produce price index data, and we are somewhat in the same boat. If the data is lower than expected, that should be some positive for investors. But if the index is more than expected, those prices would show up in consumer prices further down the road and indicate no soon end to inflation.
The Fed believes inflation is transitionary and will move back below 2% in the second half of the year. Some analysts would disagree. You can decide who you want to believe. Or just follow the master fortune teller: the market. Do expect a rough ride.
Stay healthy and trade safe!

NASDAQ not looking goodNot looking good at all. Doesn't look like it's going to hold support at 13,600 and thus a fall down to previous supports of 13,000 is quite likely - although if there's any life left in tech, we might see a little bump in attempt to regain 13,600 before a straight up fall down to 13,000.
Double top formation looking pretty bearish.. everything not looking so sweet as it was just a little bit ago - and not entirely unexpected after such a rally that jumped up leaving a lot of gaps to fill on the reverse.

Nasdaq Composite: Rise of the Noise Traders
I have to highlight that, the American stock market in 2021 is fundamentally different from the market in 2018 or 2019. Unprecedented amount of new investors have jumped into the stock market since April 2020, lured by zero commission brokers, close to zero interest rate and the boredom of COVID restrictions. Like I have mentioned before, the period of 2020-2025 bear many similarities with 1921-1929 and 1995-2000, e.g. pent up demand from the Great War and Spanish flu, super easy monetary policy, everyone suddenly becoming interested in the stocks.
Perhaps the majority of those new investors can be identified as noise traders of behavioral finance. They believe in information which they think would help them make quick profits but in fact they are no better than random noise. A market full of noise traders tend to either overreact or delay reaction against important news, making the efficient market hypothesis completely unrealistic. The market might be overreacting to the potential of high inflation right now, so IXIC will probably drop to 12400, testing the 200-day and 10-month moving average and forming a double bottom with the 5 March 2021 trough.
Sooner or later, noise traders will realise that it is still too early to worry about monetary tightening, then IXIC will roar back into 14000s, going up to 17000 in late August and early September.
The tech stock market is highly sentimental right now. If we get more good news in the second half of this year, IXIC could go as high as 20000 this year, in a similar fashion with the meteoric rise of 1997. Either way, the big picture remains extremely bullish, so the doomsayers and short-sellers would definitely be crushed by hordes of noise traders who don't give a damn about 'overbought technical indicators'.

Daily Market Update for 5/11Summary: A gap down must have shocked the bulls into action as the major indices crawled their way back up from morning lows. The results show a rotation happened underneath a market sell-off. Growth stocks benefited from the rotation while the broader market had more than two declining stocks for every advancing stock.
Notes
Ideas always welcome in the comments. Errors will be amended as comments on TradingView or corrected inline in my blog.
-=x=-=x=-=x=-=x=-=x=-=x=-=x=-
Tuesday, May 11, 2021
Facts: -0.09%, Volume lower, Closing range: 89%, Body: 87%
Good: Solid green body as bulls take over after gap down
Bad: Lower high, lower low, lower close
Highs/Lows: Lower high, lower low
Candle: Thick green body with short upper wick and high closing range
Advance/Decline: Two declining stocks for every advancing stock
Indexes: SPX (-0.87%), DJI (-1.36%), RUT (-0.26%), VIX (+11.09%)
Sectors: Materials (XLB +0.33%) and Communications (XLC -0.29%) were top. Financials (XLF -1.77%) and Energy (XLE -2.57%) were bottom.
Expectation: Sideways or Lower
-=x=-=x=-=x=-=x=-=x=-=x=-=x=-
Market Overview
A gap down must have shocked the bulls into action as the major indices crawled their way back up from morning lows. The results show a rotation happened underneath a market sell-off. Growth stocks benefited from the rotation while the broader market had more than two declining stocks for every advancing stock.
The Nasdaq closed down -0.09% on lower volume. Despite a thick green-bodied candle, the lower high, lower low and lower close continue a downtrend that's in its ninth day. The body covers 87% of the candle with a closing range of 89% under a thin upper wick. Two stocks declined for every advancing stock.
The Russell 2000 (RUT) was the next best major index with a -0.26% decline. The S&P 500 (SPX) lost -0.87%. The Dow Jones Industrial (DJI) closed with a -1.36%, gapping down after setting a new all-time high yesterday.
The VIX volatility index advanced +11.09% after being up more than 20% intraday.
Only Materials (XLB +0.33%) ended the day with gains while Communications (XLC -0.29%) was the second best sector. Financials (XLF -1.77%) and Energy (XLE -2.57%) moved the bottom of the sector list.
-=x=-=x=-=x=-=x=-=x=-=x=-=x=-
Economic Indicators
The US Dollar (DXY) declined -0.12%.
The US 30y, 10y and 2y treasury yields all rose for the day.
High Yield Corporate Bond (HYG) prices and Investment Grade Corporate Bond (LQD) prices declined.
Silver (SILVER) and Gold (GOLD) advanced. Crude Oil (CRUDEOIL1!) advanced. Timber (WOOD) declined. Copper (COPPER1!) advanced while Aluminum (ALI1!) declined.
-=x=-=x=-=x=-=x=-=x=-=x=-=x=-
Investor Sentiment
The put/call ratio rose slightly to 0.865. The put/call ratio (PCCE) is a contrarian indicator that shows overly bullish or overly bearish investor behavior. The 0.7 level is considered normal. As it approaches 0.60 (overly bullish) and below, watch for a possible pullback in the market.
The CNN Fear & Greed index remains at neutral, moving just slightly to the fear side.
-=x=-=x=-=x=-=x=-=x=-=x=-=x=-
Market Leaders
Amazon (AMZN) was the only big four mega-cap to gain for the day, advancing +1.05% to get back above the 50d MA after gapping down at open. Apple (APPL) declined -0.74%, closing below its 50d MA. Microsoft (MSFT) declined -0.38% but was able to climb back above the 40d MA before close. Alphabet (GOOGL) lost -0.95% and closed below its 21d EMA.
At the top of the mega-cap list were PayPal (PYPL), Netflix (NFLX), Adobe (ADBE) and Amazon (AMZN). Most mega-caps declined for the day. The biggest decliners include Exxon Mobil (XOM), Oracle (ORCL), Home Depot (HD) and Chevron (CVX).
Growth stocks had a great day, especially considered against the major indices. Fastly (FSLY), Palantir (PLTR), FUTU Holdings (FUTU), Fiverr (FVRR), and Chewy (CHWY) were top gainers with advances above 5%. All of these could be marking bottom pivots if rotation continues into growth. At the bottom of the growth stock list were Draft Kings (DKNG), RH (RH), GrowGeneration (GRWG) and DR Horton (DHI).
-=x=-=x=-=x=-=x=-=x=-=x=-=x=-
Looking ahead
Consumer Price Index data for April will be released on Wednesday. An indicator of inflation, the numbers will be watched closely. Crude Oil Inventories will be updated in the morning after market open. The 10y treasure note auction will be in the afternoon.
Toyota Motor (TM) along with a large number of Japanese company earnings reports will be released on Wednesday. Some other interesting reports will include Dynatrace (DT) and Bumble (BMBL).
-=x=-=x=-=x=-=x=-=x=-=x=-=x=-
Trends, Support and Resistance
The Nasdaq remains below the 50d moving average line.
The one-day trend, if it continues, would result in a +1.69% gain. That would bring the index back above the 50d MA.
The five-day trend line points to a -0.36% decline tomorrow.
Following the trend-line from the 4/29 high would result in a -0.83% decline.
-=x=-=x=-=x=-=x=-=x=-=x=-=x=-
Wrap-up
It's not clear to me why investors decided to jump back into growth stocks today. Perhaps they see a bottom and wanted to catch it. Or it's possible that a record amount of shorts on passive instruments such as ETFs is reversing and a short squeeze is underway. Or even a gamma squeeze as market makers cover the positions.
Highly shorted ETFs have included tech and growth stocks as well as the QQQ ETF itself. So predicting where things will go next may be difficult. Expect a reaction, for better or worse, to the consumer price index data being released tomorrow, which will provide a view on inflation. I have some hope that the worst is already priced in and if the data shows less inflation than expected, we could get a boost.
Stay healthy and trade safe!

Nasdaq Falls on Mounting Inflation Fears The Nasdaq composite took a sharp dive yesterday as tech stocks continue to reel from growing inflation fears. The newly developing downtrend is likely to probe even lower in the near future as the global recovery heats up.
This downtrend is emerging from the Double Top pattern just above the psychologically significant resistance level at 14000.00. Moreover, the breakdown occurred from an Ascending Wedge pattern, making it an even more prominent bearish movement.
The price action went on to break down below the resistance-turned-support level at 13550.00, which represents yet another major bearish indication.
Notice that the initial breakdown (below the Wedge) was held back by the 100-day MA (in blue). Afterwards, the price action established a throwback to the lower end of the Wedge from below.
Once the downturn was renewed, the price action penetrated below 13550.00 and is currently testing the 200-day MA (in orange). This floating support represents the last potential turning point for the downtrend, making it a last resort for the bulls.
Unless a major rebound takes place immediately, the price of the Nasdaq may fall as low as the next major support at 12800.00, or even the 23.6 per cent Fibonacci retracement level at 12284.99, before the IXIC finds the necessary support.
At present, there doesn't seem to be any potential catalyst in sight that could prompt such a rebound.

NASDAQ - DROP to $13.000NASDAQ to DROP to $13.000
Based on a Daily- and Weekly Price Action, Pattern and Fibonacci Analysis, the Tech Index is likely to encounter further drops towards $13.000 (short-term, view daily chart) followed by a potential drop to even $12.460 (weekly chart). The market's current sentiment, nourished by fear due to possible inflation etc. and no direction at all, will make sure that the $13.000 is achievable.
And seeing interlinked index behavior whilst knowing that history does repeat itself, one can fairly assume that we are walking into one of the "hottest summers" ever. The Shiller P/E ratio will also underline that 2021 is far from being over...

Daily Market Update for 5/10Summary: Inflation looms over big tech and growth stocks like an approaching hurricane, keeping investors wondering when and how big it will hit. Last week's jobs data supported the government's case that there is still support needed for economic recovery and that inflation is transitionary. But a shutdown oil pipeline over the weekend has investors worried. And the coming updates on consumer and producer price index data are causing them to take a cautious stance.
Notes
Ideas always welcome in the comments. Errors will be amended as comments on TradingView or corrected inline in my blog.
-=x=-=x=-=x=-=x=-=x=-=x=-=x=-
Monday, May 10, 2021
Facts: -2.55%, Volume higher, Closing range: 0%, Body: 100%
Good: Nothing
Bad: All red body, selling from open to close with a failed rally of the 50d MA
Highs/Lows: Lower high, lower low
Candle: Marubozu red, no upper or lower wick
Advance/Decline: Two declining stocks for every advancing stock
Indexes: SPX (+0.74%), DJI (+0.66%), RUT (+1.35%), VIX (-9.24%)
Sectors: Utilities (XLU +1.01%) and Consumer Staples (XLP +0.76%) were top. Communications (XLC -1.92%) and Technology (XLK -2.52%).
Expectation: Lower
-=x=-=x=-=x=-=x=-=x=-=x=-=x=-
Market Overview
Inflation looms over big tech and growth stocks like an approaching hurricane, keeping investors wondering when and how big it will hit. Last week's jobs data supported the government's case that there is still support needed for economic recovery and that inflation is transitionary. But a shutdown oil pipeline over the weekend has investors worried. And the coming updates on consumer and producer price index data are causing them to take a cautious stance.
The result was a big hit to big tech and growth stocks as the Nasdaq closed with a -2.55% decline on higher volume. The ominous marubozu candle has no upper and lower wick. It is 100% red body with a 0% closing range. The high of the day was the open and the low of the day was the close. There was a brief rally as the index hit the 50d moving average, but it was short and failed sending the index below the key support line. There were two declining stocks for every advancing stock.
The Russell 2000 (RUT) also suffered from investors reducing risk, declining -2.59% for the day. The S&P 500 (SPX) declined -1.04%. The Dow Jones Industrial (DJI) was the least impacted with a -0.10% decline.
The VIX volatility index advanced +17.80% for the day.
Utilities (XLU +1.01%) and Consumer Staples (XLP +0.76%) were top sectors for the day as investors took defensive positions. Communications (XLC -1.92%) and Technology (XLK -2.52%) were the big losers.
-=x=-=x=-=x=-=x=-=x=-=x=-=x=-
Economic Indicators
The US Dollar (DXY) advanced slightly, gaining +0.05% after last week's dip.
The US 30y, 10y and 2y treasury yields all rose for the day.
High Yield Corporate Bond (HYG) prices and Investment Grade Corporate Bond (LQD) prices declined.
Silver (SILVER) declined while Gold (GOLD) advanced. Crude Oil (CRUDEOIL1!) advanced. Timber (WOOD) advanced. Copper (COPPER1!) was flay while Aluminum (ALI1!) declined.
-=x=-=x=-=x=-=x=-=x=-=x=-=x=-
Investor Sentiment
The put/call ratio rose slightly to 0.693. The put/call ratio (PCCE) is a contrarian indicator that shows overly bullish or overly bearish investor behavior. The 0.7 level is considered normal. As it approaches 0.60 (overly bullish) and below, watch for a possible pullback in the market.
The CNN Fear & Greed index remains at neutral.
-=x=-=x=-=x=-=x=-=x=-=x=-=x=-
Market Leaders
All four of the biggest mega-caps declined for the day. Amazon (AMZN) had the biggest loss with a -3.07% decline and closed below its 50d MA. Apple (AAPL) declined -2.58%, closing right at the 50d MA. Alphabet (GOOGL) declined -2.56%, closing right at the 21d EMA. Microsoft (MSFT) lost -2.09%, closing below the 21d EMA but above the 50d MA.
Not all mega-caps declined for the day. Proctor & Gamble (PG), AT&T (T), Verizon (VZ) and Johnson & Johnson (JNJ) held the top spots with over 1% gains. At the bottom of the list were Tesla (TSLA), ASML Holding (ASML), Facebook (FB) and Taiwan Semiconductor (TSM).
There were four stocks in the daily update growth list that gained for the day. Dr Horton (DHI) has been consistently done well on high demand in housing. The other three, Peloton (PTON), Etsy (ETSY), and Fastly (FSLY) were all in a very oversold state after sell-offs last week. At the bottom of the growth stock list were Lemonade (LMND), UP Fintech (TIGR), FUTU Holdings (FUTU) and Digital Turbine (APPS).
-=x=-=x=-=x=-=x=-=x=-=x=-=x=-
Looking ahead
On Tuesday, we will get the Monthly OPEC Report and the EIA Shot-Term Energy Outlook. The JOLTS Job Openings report for March will be released just after market open. FOMC Members are scheduled to speak throughout the day. There's also a 3y note-auction which is not quite as important as the 10y, but may be viewed as a preview for the longer term auction performance.
Earnings releases will include Electronic Arts (EA), Palantir (PLTR), Unity Software (U), Quantumscape (QS), Plug Power (PLUG), Upstart (UPST), Lemonade (LMND), Open Lending (LPRO), and SelectQuote (SLQT).
-=x=-=x=-=x=-=x=-=x=-=x=-=x=-
Trends, Support and Resistance
The Nasdaq fell below the 50d moving average line today after failing to keep above the 21d EMA on Friday.
I've removed the trend line from the 3/5 low and added a trend line from the 4/29 high.
The five-day trend line points to a +1.48% recovery gain tomorrow.
Following the trend-line from the 4/29 high would result in a sideways move tomorrow. That could be likely as investors wait for further input from economic data on Wednesday.
The one-day trend line points to a -1.02% loss.
-=x=-=x=-=x=-=x=-=x=-=x=-=x=-
Wrap-up
The uncertainty around inflation continues to be a drag on big tech and growth stocks. Not only does it drag down the future value of earnings potential (which will impact growth stocks more than value stocks), but it also tests investors trust of the fed not to raise interest rates. It's a certainty that if the Fed mentions anything around monetary policy changes at this point, that investors will react severely.
So what can you do? First of all, you could just go to cash and wait for better news. That news might come on Wednesday and/or Thursday if consumer and producer index data is lower than expected. The market seems to be pricing in the worst, so there's a good chance for a correction to the upside if the data shows less inflation.
But you can also just stay focused on the stocks in your portfolio. Which ones are performing better than others and seem to be less impacted by inflation news? As inflation numbers go up, it's likely those stocks will continue have better relative strength. Keep stop losses in place to protect against any sudden rotations back to higher risk segments. If you get shaken out of a position, consider holding cash instead of entering new positions until the trend changes.
Above all, always follow your system and your rules for investing your money.
Stay healthy and trade safe!


Always wait for confirmation, I'm whatching the NASDAQ $IXICThat's what I have been doing for the last few weeks. I sold almost all my positions and I'm mostly in cash now. I can see the Nasdaq TVC:IXIC is forming a second base in the bull market that began in April of 2020. History can tell that this is just another rest before the next bull run in the long term trend. This base is very similar at the last one formed from September to November os 2020. Right now I'm cautios as I look for leaders.
Last week tested its 50 day moving average and it held, today history repeats so I'm still waiting for better conditions before I get agressive. I'm being very selective looking for good relative strength to add stocks in my watchlist. Right now I have NYSE:DAR , NASDAQ:CBNK and NYSE:YETI to name a few.

Nasdaq Analisys 2021-05-10The Algotrading Multiday system is: short from May 4, 2021 from 13633.5
position performance: 0.40%
YTD performance: 10.29%
1 year performance: 41.53%
At the end of the day: maintain position
Graphic Analysis
Currently the prices are testing the support 13600, if in close the level holds then tomorrow it could rebound, otherwise there is a risk of going to test the lower band of the medium / long-term bullish trend line
I recommend observing, discussing, but as always for the operation always use your head !!