NVDA Flash Crashed! Will $90 Hold or More Blood Ahead?The market took a violent turn after Trump’s tariff bombshell, and high-flyers like NVDA are now in a fragile freefall. Is this a dead-cat bounce or a rare buying opportunity?
📉 Technical Breakdown (1H Smart Money Concepts)
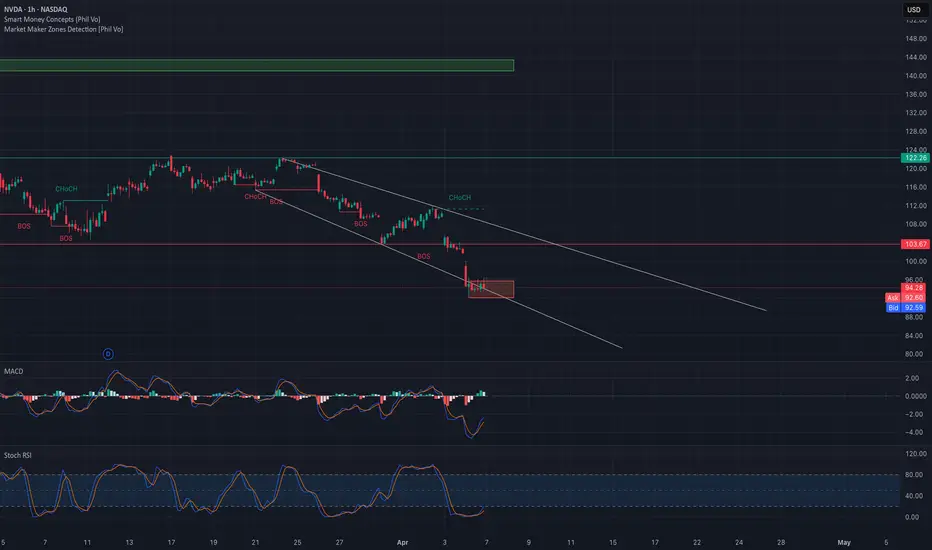
* Bearish structure confirmed via BOS at $103 and $95.
* Trading inside a well-defined downward channel—respecting trendlines.
* Currently in a consolidation box near $92, inside potential demand.
🔑 Key Levels:
* Support: $90 (must hold) → below that, $87 and $85.
* Resistance: $95.60 (highest negative NETGEX), then $102–$104 (gap fill).
* MACD & Stoch RSI showing early signs of reversal—but no confirmation yet.
🧲 Options Sentiment via GEX (1H)
* Highest Negative NETGEX at $95.60 → massive short interest.
* PUT Wall: $90 (crucial support), next level at $85.
* CALL Wall: $108–$110 = strong rejection zone this week.
* Options Oscillator:
* IVR: 65.2 | IVx avg: 92.9 → volatility priced in.
* Calls%: Only 8.7% bullish participation → extremely bearish positioning.
* GEX color: 🔴🔴🔵 = bearish zone, but potential for volatility-based reversal.
🧠 Scenarios to Watch
🔻 Bearish Trade Setup:
* Short rejection from $95–$96
* Target: $90 → $87
* Stop: $98
🔼 Bullish Scalp Idea:
* Long on confirmed reclaim of $95.60
* Target: $102–$104 (gap-fill)
* Stop: $92.50
🧳 Investor Perspective
We’re entering accumulation zones. Start building long positions below $90 in steps. Major long-term support lies between $85 and $80. Use time-based entries, not emotion.
📌 NVDA Takeaway:
* Market sentiment is fear-driven, but AI fundamentals are still intact.
* $95 = battlefield. $90 = line in the sand.
* Stay nimble. Be patient. Watch volume and flow.
🔔 Follow for daily TA with SMC + GEX setups
💬 Drop a comment: Bullish or Bearish NVDA this week?
❗Disclaimer:
This is not financial advice. This post is for educational purposes only. Do your own research and manage your risk.
🧵 Hashtags:
#NVDA #NVIDIA #OptionsFlow #GammaExposure #TechnicalAnalysis #SmartMoneyConcepts #GEX #TradingView #StockMarketCrash #TariffNews #InvestorMindset #BearMarketBounce
NVDA trade ideas
Head & Shoulders Pattern + 0.786 Fib + Gap WIndowThe measured move off the Head & Shoulders pattern presents a measured move target of $73 if price continues to fall on NVDA. The 0.786 Fib 0.786 retrace had a perfect touch on Friday. Expect a 11% bounce from the 0.786 to the gap fill above. Retrace target = 0.618 Fib. This would establish another Lower High. Trend still presents with downward momentum. Then, expect the next move down towards $75.04

NVIDIA short then longI still think NVIDIA has about 10% downside to go, then enjoy a nice long ride up. Hope the chart makes sense. Have a great day!!


Cryptocurrency and Stocks will DecoupleI still remember the AI saying that NVDA was going to 320 "in the near future." This was back in June 2024. No matter when you asked the AI, its only prediction would be up, it couldn't make an analysis based on the data coming from the chart. The program wasn't very intelligent, that's what I concluded.
I disagreed. NVDA is going down and this is now fully confirmed.
We are seeing a very long distribution phase and the crash is now taking place.
Ok, but what about Bitcoin?
Bitcoin will decouple from traditional markets, just look at the news.
While Cryptocurrency is due a generational bullish wave, the stock market is due a generational retrace.
I honestly don't know how the stock market will perform but I can look at individual charts. NVDA is bearish and going down strong.
NVDA, TSLA, the SPX, the NDX and Crypto are not the same. These are two completely different monsters.
The SPX and NDX is landline.
Crypto is free wireless internet for all.
The SPX and the NDX is centralization and control.
Bitcoin is decentralization, innovation, technology and freedom.
Times change.
The stock market will recover and it is sure to continue growing long-term.
Will the establishment let it crash or will they jump in and pump it up?
I don't know. But NVDA is bearish and going down. What one does, the rest follows.
But, what about Bitcoin? Bitcoin is going up.
It is very simple. They will decouple, they will not move together anymore. Many, many Altcoins are trading at bottom prices, many stocks are trading high up.
The giant stocks will crash, while the Cryptocurrency market goes up. This is one more of the reasons why we are about to experience the biggest bull-market in the history of Crypto.
People are evolving, the world is changing. We are changing from centralized monopoly money, to a free decentralized technology that is available for all.
Money is not the paper, the shiny stone or the codes; money is what we decide to use for the purpose of exchanging value.
At one time, salt used to be money as well as cows. Sea shells, glass and cacao are also on the list. People used to use these things as money.
The argument that Bitcoin has no value is obviously flawed. If you want to buy a Bitcoin you have to pay a price, that's value, nothing more.
If we decide to use something as money, it becomes money.
Bitcoin is money for the new generation.
The old generation dies out and a new one takes its place.
Life will continue to evolve and money will do the same.
Now it is Bitcoin, later down the road it will be something else. But Bitcoin has value, it is really expensive and it will continue to grow.
After the crash, NVDA will recover for sure.
Namaste.

Next term.In my opinion, the uptrend was already over before the trade wars started.
* The purpose of my graphic drawings is purely educational.
* What i write here is not an investment advice. Please do your own research before investing in any asset.
* Never take my personal opinions as investment advice, you may lose your money.

NVDA’s Final Act: A Breakout Waiting to HappenNVDA appears to be nearing the completion of its corrective phase, setting the stage for a potential move to new highs. The current pattern resembles a falling wedge, indicative of an ending diagonal formation, which often signals a reversal and the start of an upward trend.
The structure of the corrective channel, along with the termination of the diagonal pattern, suggests a high likelihood of a running flat formation. Buyers are likely to intensify demand pressure as the price approaches the lower boundary of the trendline. A trend reversal may occur if there is a decisive breakout above the Wave 4 level of the ending diagonal.
Buying opportunity with minimal stop is possible after the reversal from lower side of the channel. Targets can be 112 - 120 - 132 - 140.
I'll be sharing more details shortly.

$NVIDIA ─ Wyckoff Distribution #4 aka Rising Wedge PatternVANTAGE:NVIDIA ─ Wyckoff Distribution #4 aka Rising Wedge Pattern
Although Rising wedge turning into more like Rising Channel distribution idea is still valid.
#2 Long Trade TP1 Hit so far 🔥
------------
------------
Note: This is the most positive outcome possible.
As always, my play is:
✅ 50% out at TP1
✅ Move SL to entry
✅ Pre-set the rest of the position across remaining TPs
It's important to take profits along the way and not turn a winning trade into a losing trade.

Nvidia long on 2 paths to 117 Great R/R on NVidia here .. that's it really easy trade, Hard part is do you sell it all at 117 or keep some

Nvidia monthly chartAt highest pick I seen a mid or long term decrease. very high p/e and pomped prices didn't keep trend 📈 upward

Short $NVDA until ~NovemberI've had that chart drawn out for a while. Since 2018, we've had an interesting cyclical pattern of 60% drawdowns for 9-11 months every 38 months.
I'm short until ~November and/or until we reach ~$50-60. At that point, I'll turn bullish again and go long.

NVDA in demand zonefor options trader, the stock is currently in demand zone that might take him above $97 to 100

NVDA Major Trend BreakNVDA finally broke down below its major uptrend it has been in since February 2024. It did move below briefly recently during the DeepSeek sell off, but quickly reclaimed. This time it has fallen much farther below so I'd say it's a bit more concerning for bulls. It did bounce and hold right around that low it made the last time it broke, but this looks like a stronger break that has a better chance of staying below.
This is mission critical for the broader market and if it can't reclaim quickly, it is likely a signal of a longer term correction for the stock itself and the entire market. It will be very important to watch moving forward. First downside targets are 97.40 (previous double top and ATH) and 90.69 (August 2024 low).

Oct 2023 Anchored VwapNvdia was the only stock that i could find that did not touch the Oct 2023 anchored vwap. I think before the market sees a turnaround, Nvdia should touch the vwap at about $95 before it reverses. But we all know, anything can happen.


Pre market blows past support
Aint looking good for today bruv aint looking good, price so low iam afraid to hold a long short especially with monday pre being so volatile. But if price confirmation happens maybe a daily short would be good. good luck guys

Nvidia (NVDY) - Rounding top, target $40Nvidia (NVDY) - Rounding top, target $40
Top of round top is approx $155
Neckline is approx $98
Difference is $155-$97= $57
Target is Neckline ($98) - $57 = $40

NVDA bulls hold the line!another bounce near cluster support, now watching for a break of 115.11 pivot level we should move to 124 if that breaks 🎯 144 / new ATH should come when the downtrend finally comes 🎯
boost and follow for more 🔥

NVDA Slams into Key Gamma Wall After Tariff Shock. Cont. down?NVDA Slams into Key Gamma Wall After Tariff Shock – Breakdown or Bounce?
🧠 Macro Backdrop:
Today’s broad market sell-off was triggered by news of Trump proposing tariffs, sparking risk-off sentiment, especially in tech and semiconductors like NVDA. The fear of supply chain inflation and global trade disruption hit momentum stocks hard.
This news matters because:
* NVDA is a major global chip exporter.
* Tariffs = higher costs + weaker margins = bearish for NVDA fundamentals.
* Institutions are rapidly de-risking, confirmed by volume + options flow.
📊 Technical Analysis (1H Chart)
Structure:
* NVDA broke back below the 108 support — now acting as resistance.
* Price is currently sitting around 104.13, probing the gamma support band and near a key demand level at 104–105.
* This level coincides with PUT Support and HVL zone, meaning dealers might defend here, if they aren’t forced to hedge further.
Trend:
* Short-term: Bearish.
* Price rejected from the 114–115 CALL wall cluster (Gamma Ceiling).
* Forming lower highs and lower lows, confirming distribution + breakdown structure.
🔥 GEX + Options Flow Analysis
Dealer Positioning:
* GEX: 🔴🔴 — strong negative gamma zone, meaning dealers short gamma and are selling into weakness.
* As price drops, dealers sell more → amplifying downside moves.
* Current GEX Setup:
* Highest positive NETGEX/Call Resistance at 114–115 → unlikely to reclaim this without catalyst.
* Put Support near 104.6, aligning with today’s bounce attempt.
Options Data:
* IVR: 23 → relatively low.
* IVx avg: 54.5 vs current IVx = 23 → volatility is still compressed despite crash.
* CALLS only 6.5% → very bearish skew.
* Put Wall at:
* 104.6 (support) — holding for now.
* 100 — if 104 breaks, this is the next magnet.
🧭 Trade Scenarios
🐻 Bearish Continuation:
* Trigger: Breakdown below 104 support zone.
* Target: 100 psychological + PUT Wall (high confluence).
* Stop: Close above 108.
* Notes: Watch for macro headlines to further accelerate this breakdown.
🐂 Relief Bounce Setup:
* Trigger: Strong bounce and reclaim of 108 with volume.
* Target: 110 → 112 retest (low probability unless sentiment shifts).
* Invalidation: New low below 104 with momentum.
📌 Commentary:
This chart perfectly reflects a dealer-driven gamma crash fueled by a macro catalyst. NVDA was already in a downtrend, and today’s tariff news created the conditions for:
* Breaking demand structure.
* Triggering delta hedging from dealers.
* Pushing price into low-liquidity zones near PUT walls.
The bounce off 104 may be short-lived unless macro fear eases.
⚠️ Final Take:
* Bias: Bearish below 108.
* If 104 breaks, look for a flush to 100.
* Volume confirms institutional exit, and options data shows dealers are selling rips, not buying dips.
📉 Trade Idea:
Buy PUTS (1–2 weeks out) if price rejects 108 retest.
Strike: 102P or 100P
Stop: SPOT above 109
Target: $100–$101 zone
This analysis is for educational purposes only and does not constitute financial advice. Trade at your own risk.

$NVDA | A Double Bottom in the Making? We’re spotting the early structure of a double bottom pattern forming on NASDAQ:NVDA — a classic bullish reversal signal. After a steep decline, price action is showing signs of stabilization, testing support twice, and trying to recover from the lows.
But there’s a catch...
📌 No confirmation yet.
The neckline still needs to be broken with strong momentum to validate this formation and trigger potential upside.
⚠️ Today’s tariff-related news could be the catalyst. A strong reaction may either confirm the breakout or invalidate the pattern entirely.
What to watch:
Break above the neckline with volume = potential entry ✅
Failure + breakdown = more pain to come ❌
This is a key technical level. Stay sharp and let price action lead the way.

NVDA - Moving Average showing Downtrend - Target $100
NVDA
Moving Average showing downward trend. Expecting Target $100 with Bearish Strategy before it starts moving again upward after Trump's Announcement on Tariffs April 02, 2025 at 04:00 PM EST.

ascending triangle forming on 15m chartNVDA on the 15m chart looking ready to breakout of bullish ascending triangle pattern.

NVIDIA The chance to buy for $230 is NOWNVIDIA is forming a Double Bottom on a 1day RSI bullish divergence, same kind it did on the October 31st 2023 low.
The prevailing pattern is a Channel Up and the double bottom could technically kick start the new bullish wave.
The last one almost reached the 5.0 Fibonacci extension before pulling back under the 1day MA50.
Best opportunity to buy in 2025. Target just under the 5.0 Fib at $230.
Follow us, like the idea and leave a comment below!!
