NEIROETH/USDT – Double Bottom Breakout Targeting Higher LevelsHello guys!
Did you buy and hold it?
Let's see if there is another area to buy it or not!
NEIROETH/USDT has formed a double bottom pattern, leading to a sharp 357% rally. The breakout signals a strong bullish reversal, with a target around $0.10232. There’s a possible retest zone at $0.03600–$0.0

NEIRO/USDT – Breakout Zone Approaching!!Join our community and start your crypto journey today for:
In-depth market analysis
Accurate trade setups
Early access to trending altcoins
Life-changing profit potential
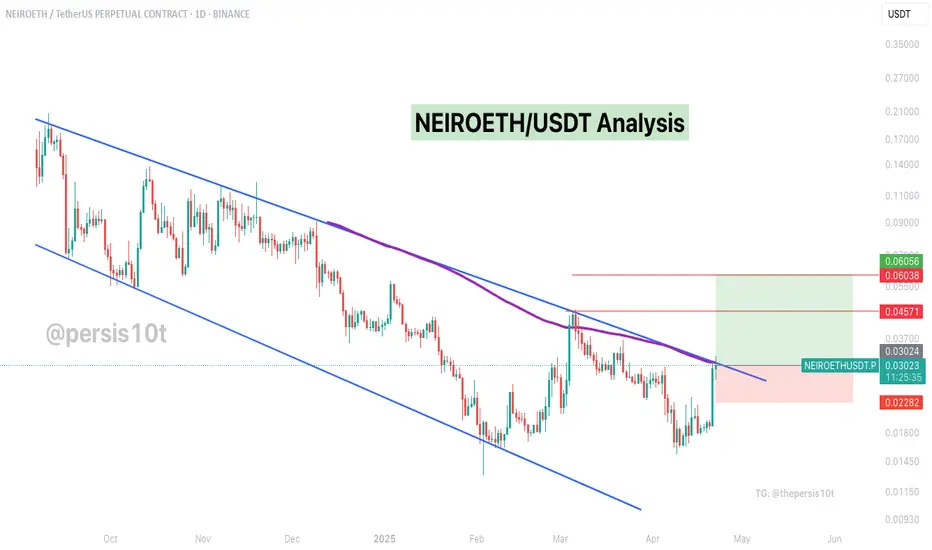
Let' analyse NEIROETHUSDT:
NEIRO is approaching a key resistance confluence — the downtrend line + 100MA on daily TF
Price is
NeiroETH — Strong Rebound Zone Hit. Big Move Loading?We just tapped into a major demand zone at 0.01532–0.01607, and the reaction was immediate — strong bounce straight off the level.
From here, I’m looking for at least a recovery into the mid-range of the descending channel, with potential for much more.
Main target — a breakout above the local ATH

#NEIROETHUSDT maintains bearish momentum❗️Keep an eye on the BYBIT:NEIROETHUSDT.P — the structure suggests a possible local rebound or a breakout of the wedge to the upside. Opening a short here goes against the structure and lacks confirmation
📉 SHORT BYBIT:NEIROETHUSDT.P from $0.01612
🛡 Stop loss $0.01693
🕒 Timeframe: 1H
✅ Overv

NEIROETH ANALYSIS (12H)It appears that the NEIROETH diametric pattern started from the point where we placed the green arrow on the chart and completed at the point where we placed the red arrow.
Since the bullish pattern has ended and the price is below the descending trendline, sell/short opportunities can be considere

NEIROETH Looks Bullish (4H)The correction of NEIROETH started from the point where we placed the red arrow on the chart.
This correction appears to be a diametric pattern, and we are currently in wave f.
Wave g could complete in the green zone, leading to the start of a bullish wave.
The closure of a daily candle below the

neiro on eth is ready for an uptrend. dont fade70% to 100% increase is loading, thereafter, an aggressive move toweards 0.24 area

NEIROETHUSDT Long BINANCE:NEIROETHUSDT.P
0.04450 enter
Take profits
0.04750
0.05200
0.05700
Sl
0.04300

NEIROETHUSDTHi.
after 60% grow, we need to calm down... so use the oportunity
order blocks in lower zones must fill then we will continue

NeiroETHUSDT: Symmetrical Triangle Breakout WatchNeiroETHUSDT is currently trading within a potential symmetrical triangle formation. Our immediate focus is on the supply zone, which is expected to push the price down towards the buy-back zone.
If the price manages to break above this supply zone, we will look to initiate buying on a pullback, a

See all ideas
Summarizing what the indicators are suggesting.
Oscillators
Neutral
SellBuy
Strong sellStrong buy
Strong sellSellNeutralBuyStrong buy
Oscillators
Neutral
SellBuy
Strong sellStrong buy
Strong sellSellNeutralBuyStrong buy
Summary
Neutral
SellBuy
Strong sellStrong buy
Strong sellSellNeutralBuyStrong buy
Summary
Neutral
SellBuy
Strong sellStrong buy
Strong sellSellNeutralBuyStrong buy
Summary
Neutral
SellBuy
Strong sellStrong buy
Strong sellSellNeutralBuyStrong buy
Moving Averages
Neutral
SellBuy
Strong sellStrong buy
Strong sellSellNeutralBuyStrong buy
Moving Averages
Neutral
SellBuy
Strong sellStrong buy
Strong sellSellNeutralBuyStrong buy
Displays a symbol's price movements over previous years to identify recurring trends.