Growth up to 200% according to NFPTo date, the market continues to move exactly according to the scenario that I outlined in the last review. On Monday and Tuesday, the probability of a flat with sales attempts prevails, but from the middle of the week I expect the bullish trend to continue as part of a pullback on the annual candle and seasonal growth with an attempt to consolidate in the range of 3250-3500 ETH.
This week, NFP and SHELL reached medium-term supports, which I am now taking into account to work alongside TURTLE NTRN MITO VIC ENSO HOOK BMT. At the moment, 50% of tokens are already in circulation with further smooth unlocking, which will put minimal pressure on the price. In the future, the area for reliable scalping will shift slightly next year. For this instrument, there are long-term technical signals for growth up to 0.35-45, that is, 10X+. However, with the current bear market, we can still expect an attempt to retest the 0.060-75 range with a further pullback and resumption of growth in a new annual candle, which can already bring up to 150% profit. The intermediate resistance is the 0.05 level. If the daily or weekly candle opens higher, an active continuation of growth is likely. The opening of the second half of the month above this level will also be a signal for support.
Trade ideas

NFPUSDT 1D#NFP is moving inside a descending channel on the daily timeframe chart. If it closes the daily candle above the midline of the channel, we can expect the following targets:
🎯 $0.0519
🎯 $0.0606
In case of a breakout above the channel resistance and the daily SMA100, the potential targets are:
🎯 $0.0749
🎯 $0.0979
🎯 $0.1166
🎯 $0.1352
🎯 $0.1617
🎯 $0.1955
⚠️ Always remember to use a tight stop-loss and maintain proper risk management.

#NFB/USDT Forming Descending Channel #NFB
The price is moving within a descending channel on the 1-hour frame, adhering well to it, and is heading for a strong breakout and retest.
We have a bearish trend on the RSI indicator that is about to be broken and retested, supporting the upside.
There is a major support area (marked in green) at 0.0600, which represents a strong basis for the upside.
For inquiries, please leave a comment.
We are in a consolidation trend above the 100 moving average.
Entry price: 0.0665
First target: 0.0693
Second target: 0.0740
Third target: 0.0798
Don't forget a simple matter: capital management.
When you reach the first target, save some money and then change your stop-loss order to an entry order.
For inquiries, please leave a comment.
Thank you.

NFPUSDT Forming Bullish PennantNFPNUSDT is showing a promising technical setup with the formation of a bullish pennant pattern, a classic continuation signal that often leads to strong upward momentum. After a strong upward leg, the price has entered a brief consolidation phase, creating a pennant structure that is now hinting at the possibility of a breakout. The market volume is supportive, which strengthens the bullish outlook and suggests that traders and investors are closely watching this move.
The expected gain for NFPNUSDT is projected between 40% to 50%+, which aligns with the measured move from the pennant formation. This makes the setup attractive for short to mid-term traders aiming to capitalize on breakout opportunities. If the breakout sustains with strong volume, the next resistance levels could be tested quickly, providing momentum-driven gains.
Investor interest in this project continues to grow, which could serve as a catalyst for further upside. With the combination of strong technical structure, solid volume, and increasing market participation, NFPNUSDT has the potential to see significant price appreciation in the coming sessions. Monitoring the breakout level will be key for traders looking to enter at optimal points.
✅ Show your support by hitting the like button and
✅ Leaving a comment below! (What is You opinion about this Coin)
Your feedback and engagement keep me inspired to share more insightful market analysis with you!

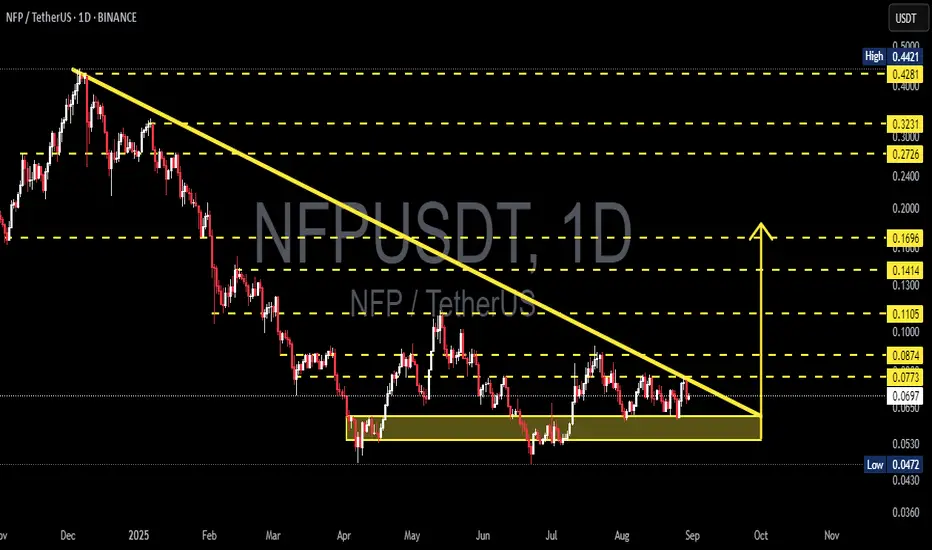
NFP/USDT — Descending Triangle, Watch for Breakout or Breakdown?The pair NFP/USDT is currently at a critical juncture. The chart shows a clear Descending Triangle pattern: a series of lower highs (seller pressure) aligned with a falling trendline, while a strong horizontal support zone around 0.047 – 0.062 continues to hold as buyers defend it.
Typically, this formation suggests a bearish continuation, but as the price approaches the triangle’s apex, the probability of a bullish breakout also rises if supported by strong volume. In other words, NFP is now in a “do or die” position — preparing for its next major move.
---
🔎 Technical Structure & Key Levels
Main Pattern: Descending Triangle → generally bearish bias, but breakout upside is possible.
Current Price: ~ 0.0697, very close to the apex, signaling an upcoming strong move.
Strong Support Zone: 0.047 – 0.062 (demand area repeatedly tested).
Key Resistance near trendline: 0.077 – 0.087 (bullish breakout confirmation zone).
Next Resistances: 0.1105, 0.1414, 0.1696, then 0.2726 – 0.3231, and 0.4421 (major historical resistance).
---
📈 Bullish Scenario — Breakout Potential
If NFP breaks above the descending trendline and closes a daily candle above 0.077 – 0.087 with strong volume, a medium-term reversal could be underway.
🎯 Short-term target: 0.1105
🎯 Next targets: 0.1414 – 0.1696
🎯 Extended targets: 0.2726 – 0.3231, up to 0.4421 if momentum sustains
🔑 Additional confirmation: successful retest of the breakout zone, proving buyer strength.
---
📉 Bearish Scenario — Breakdown Continuation
If price breaks below the strong support 0.0472, the descending triangle confirms as a bearish continuation pattern.
🎯 First target: 0.036 – 0.030 (next historical support zone).
🎯 Deeper targets possible if selling pressure accelerates.
🔑 Additional confirmation: failed retest of the broken support, turning into resistance.
---
⚖️ Key Takeaways
NFP/USDT is at a decision point. The descending triangle is tightening and a big move is near.
Bias: Slightly bearish due to the pattern, but bullish reversal remains possible with a breakout above 0.087 and strong volume.
Conservative traders: Wait for confirmation before entry. False breakouts/breakdowns are common without volume.
Risk management is crucial: set stop-loss below the support zone for longs, or above breakout levels for shorts.
---
As price approaches the apex of the triangle, volatility usually spikes. That means a decisive move is coming soon — either a breakout rally or a bearish continuation. For now, NFP/USDT is a must-watch: will buyers flip the script, or will sellers win the battle?
#NFP #NFPUSDT #Crypto #TechnicalAnalysis #DescendingTriangle #SupportResistance #Breakout #BearishOrBullish #CryptoTrading
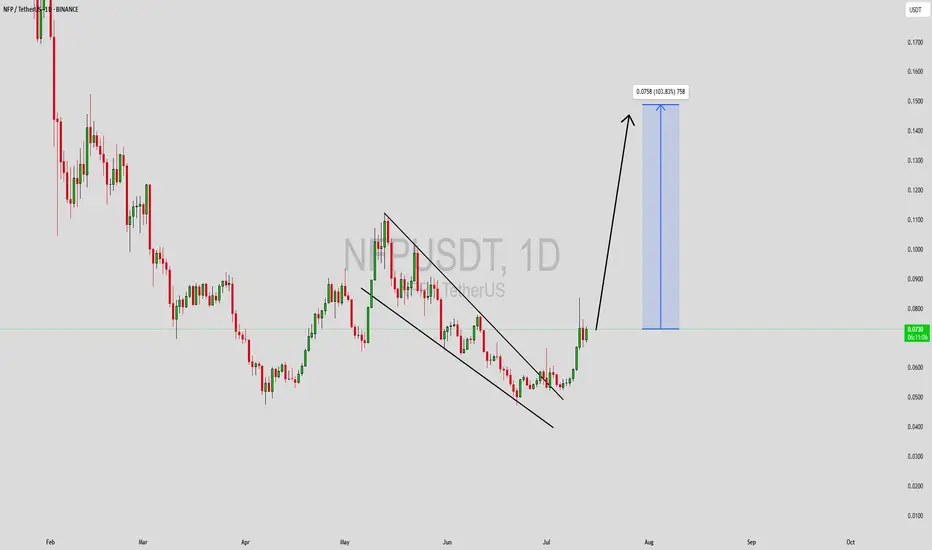
NFPUSDT Forming Descending ChannelNFPUSDT is starting to attract significant attention as it shows signs of reversing its downward trend with a promising technical setup. This crypto pair has recently broken out of a descending channel, indicating that selling pressure might be subsiding while buyers are stepping in. The price structure suggests a clear path for a potential bullish continuation, and the projected target hints at a strong gain of around 90% to 100%+. Technical traders are closely watching this level for a confirmed breakout and a sustained rally.
The volume on NFPUSDT remains good, showing that liquidity is healthy and there’s active participation from traders and investors. This is a critical factor in validating the breakout — when volume aligns with price action, the odds of a strong move increase. Many crypto traders rely on these confirmation signals to enter early positions, capturing the momentum as it picks up. With the market sentiment slowly shifting, NFPUSDT could see an influx of new interest in the coming weeks.
Investors are increasingly taking interest in this project, not just from a technical perspective but also due to its fundamentals and community engagement. As the crypto market looks for solid setups in a sea of volatility, pairs like NFPUSDT stand out for their clear patterns and realistic upside potential. Keep an eye on support levels holding firm and whether the breakout candle closes above resistance with strength.
✅ Show your support by hitting the like button and
✅ Leaving a comment below! (What is You opinion about this Coin)
Your feedback and engagement keep me inspired to share more insightful market analysis with you!
NFP/USDT double bottomNFP has formed a clear double bottom pattern on the daily time frame, signaling a potential trend reversal. Volume is gradually picking up, indicating growing interest and possible momentum shift.

NFPUSDT Bottoming Out for a Major Reversal?After completing a 5-wave bearish cycle within a descending broadening wedge, NFP is now trading within a key re-accumulation zone, suggesting a potential macro reversal is forming. The price recently rejected from the $0.1133 resistance and may continue consolidating before initiating a bullish leg towards the re-accumulation zone.
A confirmed breakout above the trendline structure at $0.1853 could kickstart a multi-phase rally with long-term targets above $1.50. Patience is key as we monitor this unfolding structure.

NFP ANALYSIS🚀#NFP Analysis : Pattern Formation💲💲
🔮As we can see in the chart of #NFP that there is a formation inverse head and shoulder pattern and it's a bullish pattern. Also there is a perfect breakout and retest of the levels. This indicates a potential bullish move.📈📈
🔰Current Price: $0.0910
🎯 Target Price: $0.1100
⚡️What to do ?
👀Keep an eye on #NFP price action. We can trade according to the chart and make some profits. The price must close above the neckline. After that we will see a bullish move. ⚡️⚡️
#NFP #Cryptocurrency #TechnicalAnalysis #DYOR

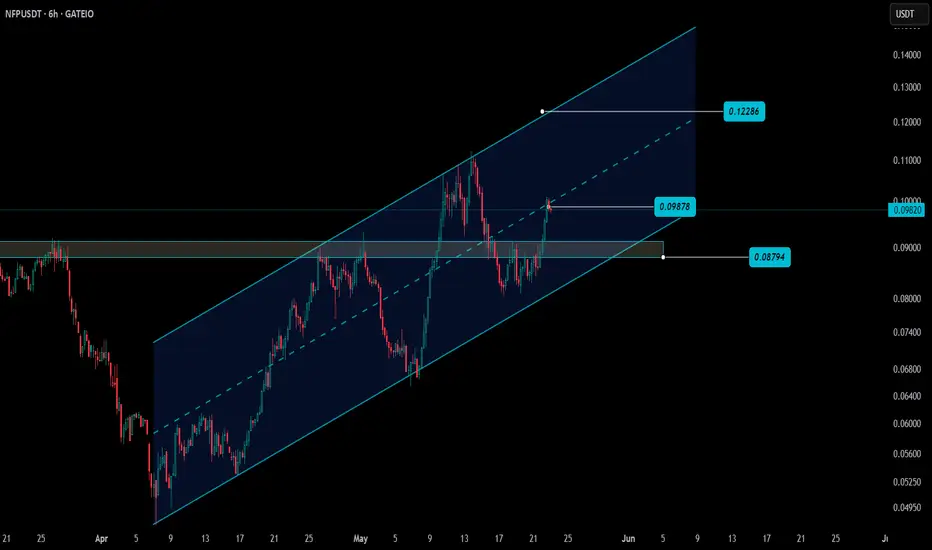
$NFP – Ascending Channel in Play📈 NEWCONNECT:NFP – Channel Watch
🗓 On the daily timeframe, NEWCONNECT:NFP is trending within an ascending channel and is currently testing the mid-level support/resistance 🔄
🛡 If this zone holds, bulls could drive price toward the upper boundary of the channel 🎯
📊 Structure remains intact — and momentum may be gearing up for continuation.
👀 Stay sharp — this could develop into a strong move!
NFPUSDT 1D#NFP is breaking out above the descending broadening wedge pattern on the daily chart. In case of a successful retest of the pattern and breakout above the EMA100, the targets are:
🎯 $0.1406
🎯 $0.1982
🎯 $0.2458
🎯 $0.2914
⚠️ Use a tight stop-loss.

NFP breakout soon!!!#NFP Buy gradually from here or wait for breaking through this resistance line with a short-term target of at least 10%+.

NFPUSDT 1D Analysis NFP ~ 1D Analysis
#NFP On the verge of a breakout. Buy after successfully breaking this resistance line with a short term target of at least 10%+ from here.

NFP: A Hidden Gem?#NFP has crashed over -95% since its late 2023 listing.
However, the rebound it had last month may signal the end of the downtrend.
Holding above $0.0545 (stop-loss) is crucial to avoid new ATLs and to validate a potential bullish reversal targeting higher levels.
#NFPrompt

#NFP/USDT#NFP
The price is moving within a descending channel on the 1-hour frame, adhering well to it, and is heading for a strong breakout and retest.
We are seeing a bounce from the lower boundary of the descending channel, which is support at 0.0700.
We have a downtrend on the RSI indicator that is about to be broken and retested, supporting the upward trend.
We are looking for stability above the 100 moving average.
Entry price: 0.0714
First target: 0.0726
Second target: 0.0744
Third target: 0.0763

NFPUSDT with potential 7x opportunityNFP/USDT has established a solid bottom, with the price consistently respecting the dynamic trendline, signaling strong support. This structure suggests the potential formation of an Inverse Head and Shoulders (ISHS) pattern, a classic bullish reversal setup.
The neckline, which serves as the immediate supply area, is a critical zone to monitor for a breakout. A successful breach of this level could confirm the setup, paving the way for further upward momentum.
The final target for this bullish structure is clearly marked on the chart, aligning with a key resistance level, offering a favorable risk-to-reward opportunity for traders. Do let us know what you think about this setup.

NFP Roadmap (1D)It seems that the NFP has entered a corrective phase from the point where we placed the red arrow on the chart.
Currently, it appears to be in the bearish wave C of this phase, and wave C itself is a symmetrical pattern. At the moment, we are in wave g of this symmetrical pattern.
This symmetrical pattern could complete in the green zone, and the price may enter wave D, which is a bullish wave.
In the green zone, one could look for buy/long positions. it’s best to enter a position with confirmation.
A daily candle closing below the invalidation level would invalidate this analysis.
For risk management, please don't forget stop loss and capital management
Comment if you have any questions
Thank You

NFP Main Trend Low -90% Descending Channel 02 2025Logarithm. Time frame 3 days.
Line chart for clarity of the downward trend.
Marker, conditionally, showed the logic of price movement from key support/resistance zones — breakthrough/not breakthrough, consolidation/not consolidation. Understanding this, you should build your trading strategy.
Now is a good entry point, subject to risk management. I would advise leaving 20-30% of the money from the position in case the price falls (implementation of scenario B) to the -93-96% zone, immediately or through price growth, to the resistance of the local downward channel (which does not exist yet).
If plan A is implemented, then I would advise locally exiting part of the position at the mirror resistance zone of 0.18-0.27. There will be a reversal, and the implementation of plan B, or a cut of the zone, and then an exit.
In the long term, the “key” resistance of the pump is 0.0609, it is rational to exit there with most of the position, possibly with a protective stop, or a grid of limit orders, if there is an aggressive price movement.
Breaking the structure of the descending channel of the main trend — its reversal, which is logical. I showed it with an arrow, but it is unlikely to happen in the near future.
Locally, this is a reversal zone .

NFPUSDT 2DNFP ~ 2D
#NFP If you still have Conviction on this coin,. Buy gradually within this support block,. minimum target 20%+

NFP USDT Spot trade | 25% potential NFP USDT shows potential for a 25% pump from the current level, particularly if key support holds and there’s an uptick in buying volume. For confirmation, watch for bullish signals in price action and volume momentum on shorter timeframes. A stop-loss near recent support can help manage risk if the trend doesn’t hold.

TradeCityPro | NFP : Key Resistance and Breakout Triggers👋 Welcome to TradeCityPro!
In this analysis, I will review the NFP chart, which, based on a breakout strategy, could offer a good entry point for spot buying and futures trading. Since this coin’s chart has recently become available, I will skip the weekly timeframe analysis and focus on the daily and 4-hour timeframes.
📅 Daily Timeframe: A Critical Resistance Zone
In this timeframe, alongside Bitcoin's rally toward 99,000 and the establishment of a new ATH, NFP also experienced an upward move. It began its rise from the 0.1803 support level, testing it once before successfully breaking the 0.2599 resistance on the second attempt. Currently, it has reached a significant resistance zone between 0.3050 and 0.34.
🔍 Within the range of 0.1803 to 0.3050, there’s a rounding formation visible, which I’ve marked with a curved trendline. Over time, this curved trendline has reduced the bearish momentum in the market. Even after the initial breakdown of the 0.1803 support, this trendline provided support, pulling the price back above the level in the subsequent candle and invalidating the breakdown. Afterward, strong buying volume entered the market, driving the price toward the 0.3050 resistance.
📊 Currently, the decreasing volume during the pullback suggests a healthy trend. However, we must consider the importance of the resistance zone, as it’s the most critical area for this coin at the moment.
✅ If strong buying volume enters, the price could break through this zone and target higher levels. The next target would be 0.3990. If the RSI enters the overbought zone, we could expect higher targets like 0.5874, and the ultimate target would be the ATH at 1.1522.
⏳ 4-Hour Timeframe: Futures Triggers
In this timeframe, I’ve marked the resistance zone with multiple lines to make it easier to identify potential futures trading triggers.
🔼 Currently, the trend appears bullish, and I prefer to open long positions. A breakout above 0.3061 would be a suitable trigger for a long position. However, the issue is that, despite recent price increases, the volume has been decreasing, which isn’t a positive sign for the continuation of the trend.
📈 If 0.3061 resistance is broken, the next trigger would be 0.3495. This trigger is more reliable than 0.3061 because the latter would lead into a resistance zone, whereas breaking 0.3495 would exit this zone, allowing for smoother price increases.
🔽 On the downside, if the 0.2595 level is broken, the price will likely enter a corrective phase, potentially dropping to 0.2167. The critical RSI support to maintain bullish momentum is 44.01.
📝 Final Thoughts
This analysis reflects our opinions and is not financial advice.
Share your thoughts in the comments, and don’t forget to share this analysis with your friends! ❤️

#NFP. Win big or feel the pain! Analysis from 11/19/24Currently, the coin is in a sideways trend, where asset distribution is taking place. A breakout above the resistance level will indicate buyer strength and the potential for further growth. Exiting such accumulation zones, especially in this market, will most likely result in an upward impulse, so it makes sense to try and catch this movement.
However, if the $0.2350 level is lost, we will most likely head straight for a support test, after which we will have a clearer understanding of where the price is likely to move next (probably working from sales rather than purchases, as we are doing now).
DYOR.

NFPrompt Breaks Ending Diagonal: 600% TargetNFPUSDT (NFPrompt) is now breaking out (bullish) from an ending diagonal. Trading volume is starting to rise and is the highest since July 2024, when the ending diagonal pattern started to develop.
A break of EMA55 as resistance already happened and the last seven days have been up with only two days of consolidation. The wait is over. NFPUSDT is preparing for massive growth.
We have two targets on the chart. 200% is the first an easy target. This move that is already developing can reach 600% mid-term, within 1-3 months. It will grow fast.
Thanks a lot for your support.
Namaste.
