Aarti IndustriesAnother opportunity in the Chemical sector
After analyzing the opportunity in Deepak Nitrite, our previous post
We have analysed Aarti Industries and this chart is looking interesting as well now
AARTIIND trade ideas

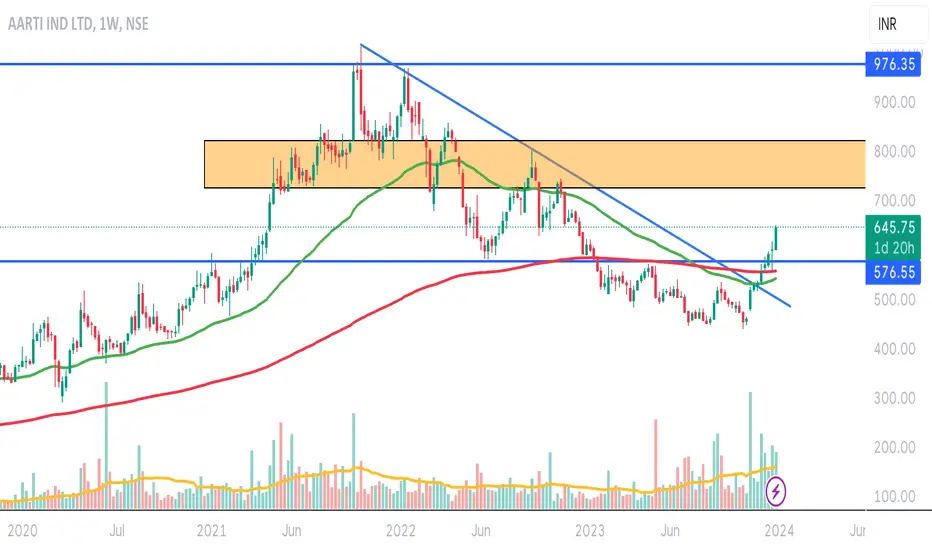
Aarti industires After a long time spent in the base the base formation has been done I think and there has been a clear divergence in the stochastic and rsi also.
if it crosses the level of 536 then a resistance can be seen at 567 this can be a range of consolidation and it would be better if it consolidates before going further up. It could be a great breakout who ever stuck in this stock don't sell as soon as you reach your level it has a high potential of touching its highs again.
After the big candle on 6th nov. with high volume it hasn't touched the lows again definitely some big investors made their positions. It is a good pattern and has been seen historically.
So make your own analysis before entering and predefine your stop loss, consult your advisor before making any investment.

AARTI INDClear breakout of resistance and trendline on weekly TF with pretty good volume. Price has just crossed both 50 and 200 EMA. One can enter for both swing and long term at CMP.

Aarthiind forms reverse cup and handle and its breaks outAarthiind forms reverse cup and handle and its breaks out

AARTI INDUSTRIES SEEMS IN WAVE 5 OF ITS PRIMARY WAVEAARTI INDUSTRIES SEEMS IN WAVE 5 OF ITS PRIMARY WAVE (Logarithmic chart)
Please note that I am not a financial advisor, and the information provided here is not financial advice. Before making any investment decisions, it's crucial to conduct thorough research or consult with a qualified financial professional.
In the context of Elliott Wave Theory applied to Aarti Industries stock:
Primary Wave 1 (Jan 2006): The uptrend started, reaching a price level of 11.70.
Primary Wave 2 (Jun 2007): A corrective wave followed, with prices decreasing to 2.8.
Primary Wave 3 (Oct 2021): The strongest upward wave occurred, reaching a price level of 1003.45.
Primary Wave 4 (Oct 2023): Another corrective wave took place, with prices dropping to 438.
Now, it's suggested that the stock is currently in the 5th of Primary degree wave, and there's a projected target of around 1085 for its cycle wave 1.
Keep in mind that Elliott Wave analysis is subjective, and interpretations may vary. It's crucial to consider other factors, such as fundamental analysis and current market conditions, and to remember that the stock market is inherently unpredictable. Past performance is not indicative of future results, and any projections or targets should be regarded as speculative and not guaranteed.
Exercise caution, seek multiple sources of information, and consider consulting with a financial professional, especially if you are not experienced in technical analysis.

AATI IND : SMA 200 + FIBO retracement. AARTI IND : The SM 200 is observed in the chart as yellow line. The price above the line provide trend reversal signal.
SInce than the prices have moved swiftly. The horizontal line is likely to act as the new support level at 572.
The retracement from the peak of 1009 to 438 gives us the important levels to look for and the same is visible on the charts.

AARTIIND Daily TF analysis Long term buyNSE:AARTIIND Long term analysis
Add more at 480 to 500 level with SL of 474
T1 594
T2 691
T3 788


Aarti IndustriesAarti Industries seems strong above 600 after a huge correction.
Even the volume spike seems getting ready for bullish rally.


Aarti Industries Chart Analysisaarti industries has given a breakout on daily chart
now wait for retesting or breakout of another resistance level
debt to equity - 0.64

AARTI IND SWING TRADE IDEAAARTI IND showing gud bullish move broke its weekly resistance zone with strong bullish candle with gud volume bar accumulated at the neck line of single strike and again picking up. interested one can look for 1:2:3 R/R.

AARTIIND about to break Range with Very Good VolumeAARTIIND about to break Range with Very Good Volume
1) In Range since Last 10 Months
2) After IPO, Current Month's Volume is 2nd Highest
3) About to break the Range
Good For Swing Trading before Breakout !!


Trend change on weekly chart, go longTrend change after a long gap, clearly indicates the upmove. GO LONG.

Aarti Industries Looking Good for a Blast🚀🍻AARTI INDUSTRIES LOOKING GOOD.
CAN BE BOUGHT AT 525
STOP 520
CAN BE HELD POSITIONALLY. Aur kuchh puchhna ho to call kar skte h 8130724243

Can It Breakout of the Zone? Let's see. Looks like its about to break out the resistance line.
Or
It will be back to support drawn by Fibonacci Retracement.
Anyhow, it is a good stock to add into watchlist.

Long term Stock .....Jaagte RahoLong term Stock .....Jaagte Raho
get ready to Double the money....
Stocks have breakout given

[Bounce] Aarti Industries Trade Idea
Note -
One of the best forms of Price Action is to not try to predict at all. Instead of that, ACT on the price. So, this chart tells at "where" to act in "what direction. Unless it triggers, like, let's say the candle doesn't break the level which says "Buy if it breaks", You should not buy at all.
=======
I use shorthands for my trades.
"Positional" - means You can carry these positions and I do not see sharp volatility ahead. (I tally upcoming events and many small kinds of stuff to my own tiny capacity.)
"Intraday" -means You must close this position at any cost by the end of the day.
"Theta" , "Bounce" , "3BB" or "Entropy" - My own systems.
=======
I won't personally follow any rules. If I "think" (It is never gut feel. It is always some reason.) the trade is wrong, I may take reverse trade. I may carry forward an intraday position. What is meant here - You shouldn't follow me because I may miss updating. You should follow the system I share.
=======
Like -
Always follow a stop loss.
In the case of Intraday trades, it is mostly the "Day's High".
In the case of Positional trades, it is mostly the previous swings.
I do not use Stop Loss most of the time. But I manage my risk with options as I do most of the trades using derivatives.
=======

Aarti industry short 445Can take short position SL 467 with minimum target
1st 453
2nd 445
3rd 430 NSE:AARTIIND
#aarti industry @aartiindustry NSE:AARTIIND


Reversal bet #aarti industriesPrice falling continuously but rsi forming beautiful base and now showing strength to move the stock upwards.. quality stock .. in the oversold zone.. contra bet investors can buy this for paisa double or good returns... stoploss below 440 wcb
