AdaniportThese are swing ideas which you can add your watchlist and analysis for yourself !
Keep on your radar!
This content only education purpose!
I am not sebi ragister!
Trade ideas

ADANI POWER ANALYSISHi, I would like to share this idea with you all on the basis of the price action analysis.
Pleasure to have you here. This is an trading/investment analysis done for the Tickr, and potential in the Technicals.
if you like the idea please like the post :) It will be a motivation to further such ideas.
Disclaimer Note:-
1) This is just an analysis setup and no advice to trade/trade
2) If you are making position, please have your risk to reward analysis and then enter.
3) The analysis and target shared does not mean i trade in them, entry and exit depends on the market open and other factors.

AdaniportTrendline breakout stock & wait for retest than entry created!
Stock trading 50 Ema bottom
These are swing idea's which you can add your watchlist and analysis for yourself.
Keep on radar.
Potential dawnside stock!

ADANIPORTSStock break neckline
Fresh downside start
Also Price break DEMA support
Charts favour for SHORTS
Globally sentiments weak
Disclaimer This is my personal view for education purpose only
No Buy sell recommendations.

Adani PortAdani Port CMP 825
Stock showing strength
Above 830 closing will show 860
Above 860 900 is also possible.
Can add for bullish view.

Adhani port We can buy at this stock at low. Monthly chart still at down trend.. Its only for knowledge sharing

ADANIPORT -set for big rallyNSE:ADANIPORTS
showing positive momentum in DAILY as well as in WEEKLY TIMEFRAME.
it could be a good time to start investing in it.
But there must be a STOPLOSS.
invest at your own risk, this is only for educational purpose.

ADANI PORTS AND SPECIAL ECONOMIC ZONE LTD.Adani Ports & Special Economic Zone is in the business of development, operations and maintenance of port infrastructure (port services and related infrastructure development) and has linked multi product Special Economic Zone (SEZ) and related infrastructure contiguous to Port at Mundra.
Company has been maintaining a healthy dividend payout of 20.8%
Promoter holding has increased by 1.86% over last quarter.
Company's median sales growth is 18.7% of last 10 years
Its consistantly growing Y/Y profit is last few years
It has potential to grow further in coming years
TECHICALLY ITS HAS FORMED CUP WITH HANDLE PATTERN
ITS AT BOTTOM OF CUP GUD OPPORTUNITY TO BUY MEDIUM TO LONG TERM
CURRETNT PRICE-817
TARGET-1238

ADANI PORTSADANI PORTS has made a diagonal structure after the drop. As wave 1 completes, there would be 38.2-50% correction on the stock which are important fibonacci levels. These levels also coincide with a strong resistance area where a bullish reversal can be found (wave 3).
This idea is based on the Elliott Wave Theory. Trade/Invest with your own risk management.

ADANIPORTS, 60 MIN [Positional Sell]This Stock looking rising in a Corrective Wave B pattern, coming close to Channel Top around865-871 - becomes a positional sell for 794 First Tgt

$ADANIPORTS at 4 hour supply zoneNSE:ADANIPORTS has taken resistance in 4h supply zone.
Plotting a short in 15 min and 4h timeframe each for a 4R as market could get to the downside and grab the liquidities before moving higher
do share your feedback

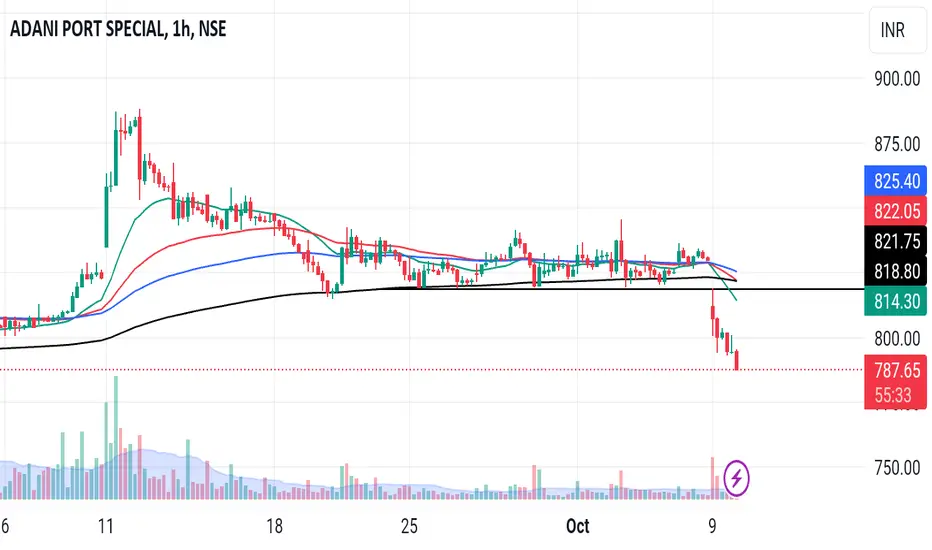
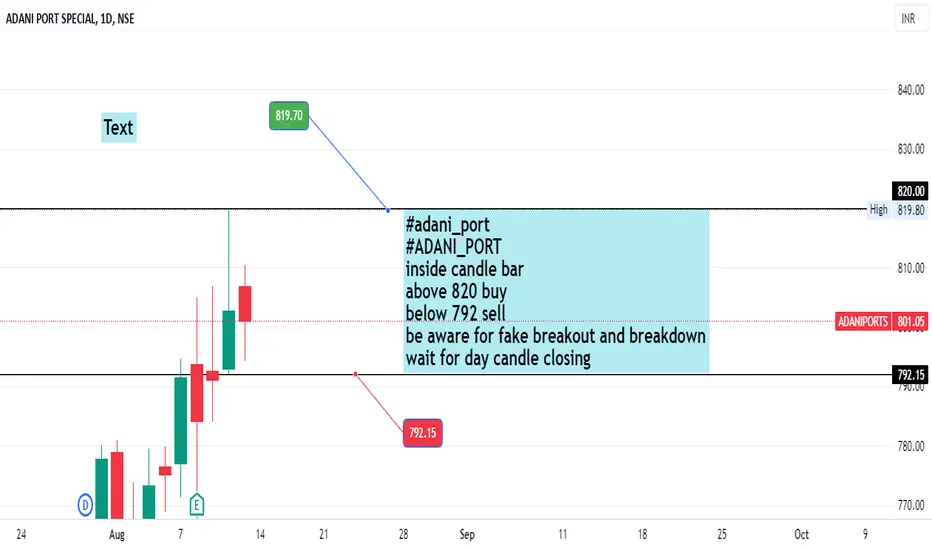
ADANI_PORT inside candle bar #adani_port
#ADANI_PORT
inside candle bar
above 820 buy
below 792 sell
be aware for fake breakout and breakdown
wait for day candle closing
ADANIPORTS 30MIN CHARTADANIPORTS 30MIN CHART
Breakout @ 763.50 Target 813 Support 740
ADANIPORTS on 30mins chart has witnessed a falling trend line breakout @ 763.50 levels.
Target projected for the pattern is placed @ 813 levels.
Its only an observation & not any suggestion.

Adani Port is about to explode.adani port is on the verge of rising triangle breakout
If breakout happens it will be a long wave of 25 percent
buy @ 790
SL - 750
target - 880 990
With an amazing Risk Reward ratio of 1:5

ADANI PORTS ASCENDING TRIANGLE BREAKOUT | BULLISH BREAKOUTAnd we got the bullish breakout in #ADANIPORTS that i was waiting for.
Entry can be initiated at current market levels with strict stop loss below 740.
Keep booking partial profits at
1. 820
2. 910
3. 975


ADANI PORTS | ASCENDING TRIANGLE | BULLISH CONTINUATIONADANI PORTS stock was trading in a downtrend making lower highs and lower lows, getting rejected by a downtrend line.
on 25 July, the price broke and closed above the downtrend line, signalling price might start moving up now.
Also, check how price is continuously making higher highs and higher lows just before breaking the downtrend line.
This shows, buyers are strong.
Currently, the price is consolidating in an ASCENDING TRIANGLE which is a BULLISH Continuation pattern.
I would be interested in the stock once Daily closes above 760 with stop loss below 725.
Targets:-
1. 825
2. 910
3.975
But first, wait for a daily breakout above the triangle.

Which way will this breakout? Adani Ports stuck in a range between 700 and 760 since 24-05-23. Which way will this breakout?
❤ & follow for more.

ADANIPORTS - Weekly trendline break and back testing the sameADANIPORTS has broken the weekly trendline and has back tested the same and held so far.
I see demand zone(Support levels) between 710 and 690.
As long as it holds those levels, see it moving towards the first Supple zone between 760-780.
If we breach that area, next targets would be 820/860

Adani port short Adani ports can be a good shirt opportunity if it breaks the important support of 714. A waterfall structure can be followed by taking short position in Adani ports from the retest levels of 726. Targets for this position are
- 700 t1
- 660 t2
It would be ideal to take a short on the retest till 726 levels

ADANI PORTS - VALUE PICK PART 2The stock has started to decouple from other Adani Group Bubble stocks.
Charts are looking extremely bullish and set up is perfect for immediate 685 and 785 targets in couple of months.
Above 590 close will trigger the inverse HS pattern.

