BHARTI AIRTELTHIS ONE HAS FINALLY BROKEN THE TRENDLINE WHICH IT CROSSES IN MAY, IT CAN BE A SELL WITH 508-509 AS STOP LOSS
TILL IT REMAINS BELOW THIS LEVELS IT HAS REACH 478-480
**********************************************************************************************************************************************
Hi all,
Its pleasure to have you all here.
I have started putting these charts as a contribution from my side to all people who are new to business, as I had to struggle a lot without any sources at disposal. So please consider this a just small contribution from my side.
Few Honest Disclosures:
1. Any idea shared is my personal view, its not a recommendation, neither any kind of paid propaganda, so please
do your bit of research.
2. Ideas shared does not mean that I trade all or have position in them, this is just a helping hand to all.
3. I expect no comments or like nor any negativity, as I said its just a small helping hand from my side, please plan your risk and trade as per your capacity.
4. To trade in Cash, options or futures is your sole choice and your own risk
5. I am no expert in Tech Indicators, I believe in support resistance and trendline theory, you may use this as a supplement theory for better results.
6. I work for my own living, this is a hobby which I do sincerely to help anyone who might come across my charts.
***********************************************************************************************************************************************
BHARTIARTL trade ideas


Intraday stock selection for 7/9/2020The main features of the descending triangle pattern are:
A flat support line.
A descending trend line that connects a series of lower highs.
The flat support line and the descending trend line converge to a poin


BHARTIARTL change in trendBharti Airtel took support at 200 DMA, even with high volume sell off on monday couldn't able to break 200 DMA, afterwards we have big bullish candle on the account of AGR verdict. and also broken recent resistence trend line. if it falls further 20 EMA is better price to enter which is at 535, it can easily rally upto recent highs of 600.


Descending channel - AirtelAirtel trading in descending parallel channel last few days. RSI confirming downtrend. We can buy at the low of the channel. We can sell at high of the channel. Minimum target for both buy and sell order is POC (Center line). This is an educational idea. Please trade on your own risk.

Very bullish bhartiairtelYesterday overall market was by 3 to 5 percent. But take a look at Bharti look at the volume and the range of the candle marked, this clear sign of selling getting absorbed by very strong buying and just watch what happened next day. One thing is clear that stronger hands were busy buying the stock when there was a sell of so very bullish on Bharti. Please use your strategy to exit or enter. Please don't sort look for long entry.


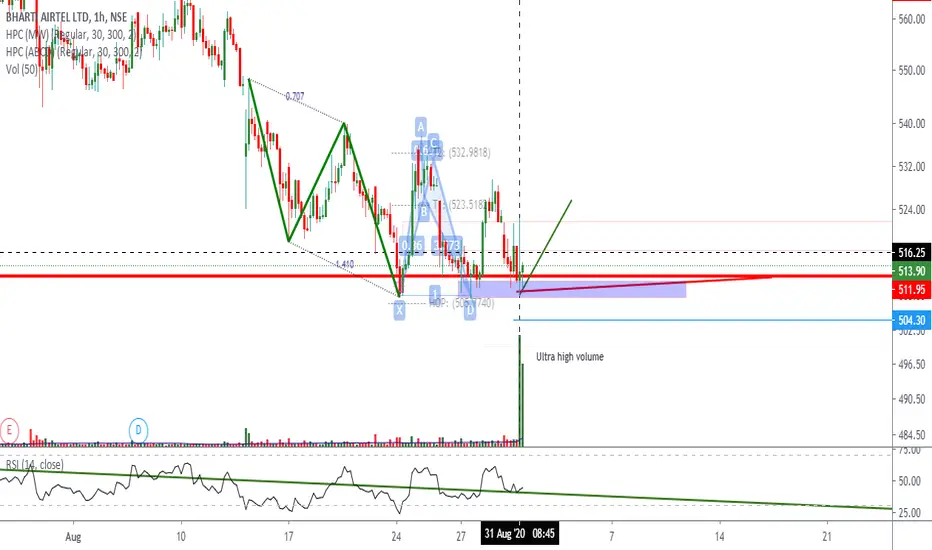
BHARTIARTL 4HRBullish Deep Crab & AB=CD Ultra high volume down bars - trap of Smart Money.. Professionals are buying into the public selling – Higher volume. IF Price breaks ULTRA HIGH VOLUME Candle HIGH with LOW VOLUMES & with NO SUPPLY l.e place for BUY
price need to follow Green Trend line & hit target
If price Breaks Red Trend line is where EXIT before SL hits
POTENTIAL BUY

BHARTIARTL 1HR Bullish AB=CD + ALT BAT Strong PRZ formed at Daily SUPPORT
Ultra high volume down bars - trap of Smart Money.. Professionals are buying into the public selling – Higher volume.
IF Price breaks Green Trend line and ULTRA HIGH VOLUME Candle HIGH with LOW VOLUMES & with NO SUPPLY l.e place for BUY
POTENTIAL BUY
BHARTIARTL Long opportunityBHARTIARTL is now approaching a 50% Fibonacci zone which is also a key demand zone from where we can see a potential rise in the stock.

BHARTIARTL Daily Bullish Butterfly formed at Daily Support, RED Horizontal lines r Daily RESISTANCE and SUPPORT
Ultra high volume down bars - trap of Smart Money.........Higher volume--Professionals are buying into the public selling
ULTRA HIGH VOLUME for going LONG we need LOW VOLUMES in the area of ULTRA HIGH VOLUME BAR
RSI must be above 30
will price go to deep crab or Reversal from here when Price on breaking of ULTRA HIGH VOLUME Candle HIGH with NO SUPPLY i.e place for BUY


Bharti Sell on riseBharti Airtel shouldnt have broken 522 level. Bearing moving average cross overs. If breaks below 500 the levels are for 475 and I wont be surprise if 400 level is seen.

After long Consolidation a breakdown could be expected in #NiftyStock has been consolidating long time in its territory of Support and Resistance, yesterday it gave closing below 50 EMA.


BHARTIARTL expected to move down towards 490NSE:BHARTIARTL
BHARTIARTL has beaten previous support and should move towards the 490 mark

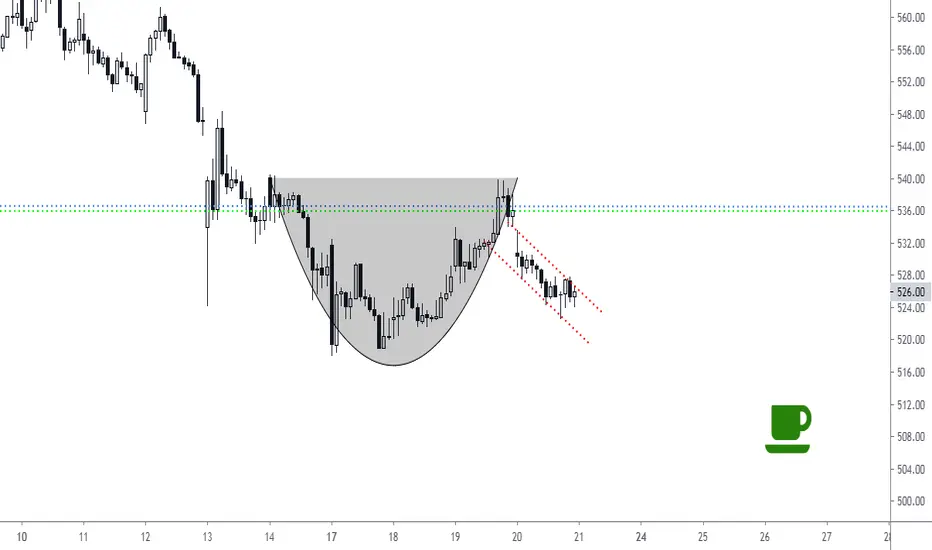
Can we see ARTL breakout soonBuy BHARTIARTL around 520 levels target 580
In mid term expecting stock to hit 800 levles.

Airtel LongMarked are the potential reversal zones and we have 200 MA on daily timeframe as well.
Disclaimer:
Please note these are for educational purpose and in case if you trade, take as per your risk and financial advisor

BHARTI AIRTELNSE:BHARTIARTL
LEVELS HAVE BEEN MARKED, PLEASE REFER CHART, FEELING LAZY TO UPDATE
**********************************************************************************************************************************************
Hi all,
Its pleasure to have you all here.
I have started putting these charts as a contribution from my side to all people who are new to business, as I had to struggle a lot without any sources at disposal. So please consider this a just small contribution from my side.
Few Honest Disclosures:
1. Any idea shared is my personal view, its not a recommendation, neither any kind of paid propaganda, so please
do your bit of research.
2. Ideas shared does not mean that I trade all or have position in them, this is just a helping hand to all.
3. I expect no comments or like nor any negativity, as I said its just a small helping hand from my side, please plan your risk and trade as per your capacity.
4. To trade in Cash, options or futures is your sole choice and your own risk
5. I am no expert in Tech Indicators, I believe in support resistance and trendline theory, you may use this as a supplement theory for better results.
6. I work for my own living, this is a hobby which I do sincerely to help anyone who might come across my charts.
***********************************************************************************************************************************************
