MIDCAP SMA SUPPORTIndian markets are in severe sell off mode since last September 2024 and February 2025 is actually worse of them all...
Midcap Index as highlighted in chart is now on WEEKLY SMA SUPPORT. I believe we wil have good bounce of 10 to 15% in March & April.
Use this opportunity to avg good stock and use this bounce to move out.
CNXMIDCAP trade ideas

Evaluating the Future of Midcaps: How Much Pain Is Left....?Midcap Correction: How Much More Pain is Left..?
The midcap sector has experienced a significant correction, currently down approximately 18% amid the broader market downturn. This raises an important question: how much more pain is left for midcaps?
Historical Context and Market Correction :
If we look at past trends, this 18% to 20% correction is not unprecedented. A similar downturn occurred in 2022, when the midcap index was corrected by around 23.3%. Therefore, it’s important to remember that such market fluctuations are a normal part of the cycle and not something entirely new.
Primary Causes of the Correction :
Two key factors have contributed to the current market correction. Firstly, the high valuations of midcap stocks coupled with slower-than-expected earnings growth over the past two quarters have created pressure on prices. While there are other contributing factors, these two stand out as the primary drivers behind the recent downturn.
However, this correction may not persist for long. Looking ahead, earnings are expected to pick up in the coming quarters, fueled by an anticipated boost in consumption due to the new income tax bill presented in the latest budget. As a result, a combination of market correction and improving earnings growth could lay the foundation for a potential recovery and a return of the bull run.
Technical Support Levels and Future Outlook :
From a technical analysis standpoint, the midcap index is currently hovering around the 49,650 mark, which is a significant support level. Additionally, this price point coincides with the 0.5 Fibonacci retracement level, reinforcing its importance as a key technical support area. The broader Fibonacci golden zone, which spans from 50,180 to 46,800, also suggests that this range will provide strong support for the midcap index in the near term.
Given these technical factors, it’s reasonable to anticipate that the downside could be limited to around 5% more from the current level of 49,650. Beyond this range, the market may stabilize, and with expected earnings growth, we could witness a market rebound in the upcoming quarters.
Risks to Consider :
While the outlook for midcaps appears optimistic, investors should remain cautious. One major risk is the ongoing trade war, which continues to create significant uncertainty in global markets. Any escalation in trade tensions could weigh on the broader market, including midcaps, and introduce additional volatility.
Conclusion :
In summary, while the midcap index has experienced an 18% correction, this level of decline is not unprecedented, and there is potential for recovery. With strong earnings growth expected in the coming quarters and key technical support levels in place, the midcap sector could see a return to positive momentum. However, caution is advised, especially considering the uncertainties surrounding the trade war. Investors should keep an eye on these developments to navigate the market with caution and opportunity in mind.

It is LET'S GO ALL IN time! 100 WEMA on midcap 100Deep red portfolios, bearish sentiments, uncertainity in geopolitics: Something similar to what happened in previous corrections (2022).
One can bet on smallcap, midcap companies near 100 WEMA - High Risk-Reward Trade

CNXMIDCAP Key levels for 21/012025**Explanation:**
This trading system helps you avoid blind trades by providing confirmation for better entries and exits.
**Entry/Exit Points:**
- **Entry/Exit Lines:** Use the BLACK line for long trades and the RED line for short trades, based on confirmation from your trading plan.
- **Stop Loss:** For long trades, set the stop loss at the RED line below. For short trades, set it at the BLACK line above.
- **Take Profit:** For long trades, target the next RED line above. For short trades, target the next BLACK line below.
**Timeframe:**
Use a 5 timeframe for trading.
**Risk Disclaimer:**
This setup is for educational purposes. I'm not responsible for your gains or losses. Check the chart for more details.

CNXMIDCAP | Keep in mind, don’t buy unless it breaks out upwardsDisclaimer:
This is not financial advice. Please do your own research or consult with a financial advisor before making any investment decisions. Investments in stocks can be risky and may result in loss of capital.

Large Caps expected to Outperform midcap over next 2 years# The Small and midcaps put together has outperformed Nifty by over 80% since covid and around 45% since march 2023. This outperformance is expected to reverse similar to what has happened from 2018 to 2020 after over 80% outperformance between 2013 to 2018.
# Last time the outperformance was driven by individual stock buying while this time it is driven by Mutual fund buying. Largest midcap fund is around 75000 crores, largest smallcap fund in 65000 crores+.
# The outperformance is mainly due to valuation stretch which has primarily happened due to excessive inflows through sip and bulk routes.
# A mean reversion of this trend can very well playout in 2025 wherein people try to lockin gains in the mid and small cap funds which has generated very high returns in last 3 years and park their money in large caps.
# So the wise trade would be to sell midcap and small cap funds to half and switch to large cap funds as the later is expected to generate higher alpha considering the valuation.

NIFTY MIDCAP ANNUAL VIEW**Midcap Analysis**
The midcap index is anticipated to experience significant volatility throughout the year. Should it surpass 61171, we anticipate highs of 68000-69400. Conversely, if it falls below the range of 55883-53035, key short covering levels will be established at 1.)49871, 2.)46323, and 3.)42500. These levels are indicated in the attached chart.

CNXMIDCAP KEY LEVELS FOR 06/11/2024**Explanation:**
This trading system helps you avoid blind trades by providing confirmation for better entries and exits. It considers volume, past prices, price range and indiavix.
**Entry/Exit Points:**
- **Entry/Exit Lines:** Use the BLACK line for long trades and the RED line for short trades, based on confirmation from your trading plan.
- **Stop Loss:** For long trades, set the stop loss at the RED line below. For short trades, set it at the BLACK line above.
- **Take Profit:** For long trades, target the next RED line above. For short trades, target the next BLACK line below.
**Timeframe:**
Use a 5 timeframe for trading.
**Risk Disclaimer:**
This setup is for educational purposes. I'm not responsible for your gains or losses. Check the chart for more details.
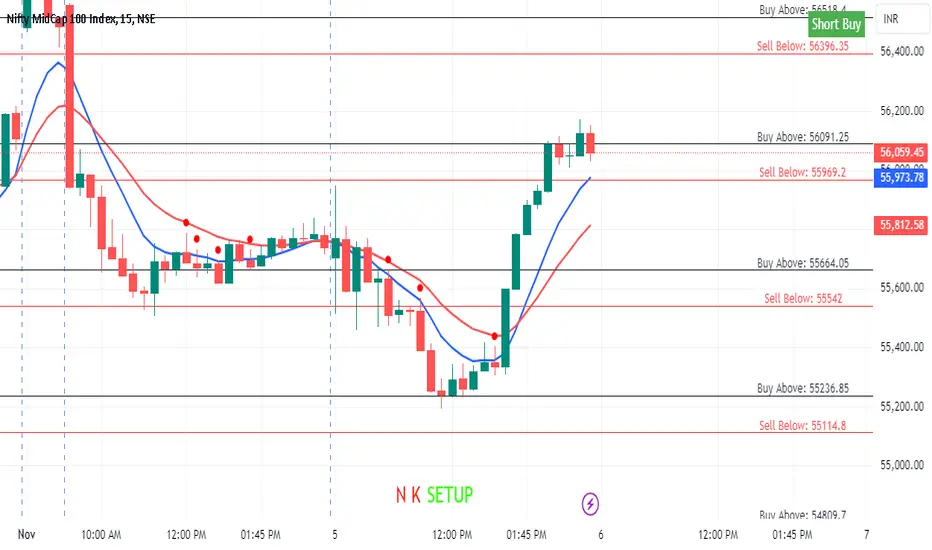
CNXMIDCAP KEY LEVELS FOR 05/11/2024//@description
// All credit goes to Tony for the concept of this indicator. His Trading View link: www.tradingview.com
// Note: The calculation method in this indicator differs from Tony's, but the concept is derived from his work.
**Explanation:**
This trading system helps you avoid blind trades by providing confirmation for better entries and exits. It considers volume, past prices, price range and indiavix.
**Entry/Exit Points:**
- **Entry/Exit Lines:** Use the BLACK line for long trades and the RED line for short trades, based on confirmation from your trading plan.
- **Stop Loss:** For long trades, set the stop loss at the RED line below. For short trades, set it at the BLACK line above.
- **Take Profit:** For long trades, target the next RED line above. For short trades, target the next BLACK line below.
**Timeframe:**
Use a 5 timeframe for trading.
**Risk Disclaimer:**
This setup is for educational purposes. I'm not responsible for your gains or losses. Check the chart for more details.

The beginning of the next bull market.As I mentioned in our previous conversation, the trade entry point was within the box. Now, we wait until December for the next phase of correction. Strong stocks with good results are expected to deliver significant returns. The correction has ended.

Final phase of correction.As soon as the candle enters the box, you can enter the trade. Based on the speed of the current downturn, this entire correction should wrap up by the end of this week. If you hold good stocks at favourable prices, there's no need to take any action—just switch off for a week. I'm expecting the bull run to start next week and continue until mid-December, around Christmas. After that, a sharp correction, as usual. Stay strong, diamond hands!

NIFTY MIDCAP KEY LEVELS FOR 14/10/2024//@description
// All credit goes to Tony for the concept of this indicator. His Trading View link: www.tradingview.com
// Note: The calculation method in this indicator differs from Tony's, but the concept is derived from his work.
**Explanation:**
This trading system helps you avoid blind trades by providing confirmation for better entries and exits. It considers volume, past prices, price range and indiavix.
**Entry/Exit Points:**
- **Entry/Exit Lines:** Use the BLACK line for long trades and the RED line for short trades, based on confirmation from your trading plan.
- **Stop Loss:** For long trades, set the stop loss at the RED line below. For short trades, set it at the BLACK line above.
- **Take Profit:** For long trades, target the next RED line above. For short trades, target the next BLACK line below.
**Timeframe:**
Use a 5 timeframe for trading.
**Risk Disclaimer:**
This setup is for educational purposes. I'm not responsible for your gains or losses. Check the chart for more details.
CNXMIDCAP Key Levels for 10/10/2024//@description
// All credit goes to Tony for the concept of this indicator. His Trading View link: www.tradingview.com
// Note: The calculation method in this indicator differs from Tony's, but the concept is derived from his work.
**Explanation:**
This trading system helps you avoid blind trades by providing confirmation for better entries and exits. It considers volume, past prices, price range and indiavix.
**Entry/Exit Points:**
- **Entry/Exit Lines:** Use the BLACK line for long trades and the RED line for short trades, based on confirmation from your trading plan.
- **Stop Loss:** For long trades, set the stop loss at the RED line below. For short trades, set it at the BLACK line above.
- **Take Profit:** For long trades, target the next RED line above. For short trades, target the next BLACK line below.
**Timeframe:**
Use a 5 timeframe for trading.
**Risk Disclaimer:**
This setup is for educational purposes. I'm not responsible for your gains or losses. Check the chart for more details.

CNXMIDCAP KEY LEVEL 07/10/2024//@description
// All credit goes to Tony for the concept of this indicator. His Trading View link: www.tradingview.com
// Note: The calculation method in this indicator differs from Tony's, but the concept is derived from his work.
**Explanation:**
This trading system helps you avoid blind trades by providing confirmation for better entries and exits. It considers volume, past prices, price range and indiavix.
**Entry/Exit Points:**
- **Entry/Exit Lines:** Use the BLACK line for long trades and the RED line for short trades, based on confirmation from your trading plan.
- **Stop Loss:** For long trades, set the stop loss at the RED line below. For short trades, set it at the BLACK line above.
- **Take Profit:** For long trades, target the next RED line above. For short trades, target the next BLACK line below.
**Timeframe:**
Use a 5 timeframe for trading.
**Risk Disclaimer:**
This setup is for educational purposes. I'm not responsible for your gains or losses. Check the chart for more details.

NIFTY MIDCAP - Monthly RSI in Overbought zone.Monthly RSI of NIFTY MIDCAP is 89 (Deep overbought Zone). On earlier occasion whenever RSI has crossed above 73 on monthly chart, either it went on sideways or corrected severely. Will this time be different! Can liquidity flow sustain the RSI for a longer period of time! Interesting to see in the next 2 months.

CNXMIDCAP Key levels for 25/09/2024**Explanation:**
This trading system helps you avoid blind trades by providing confirmation for better entries and exits. It considers volume, past prices, and price range.
**Entry/Exit Points:**
- **Entry/Exit Lines:** Use the BLUE line for long trades and the RED line for short trades, based on confirmation from your trading plan.
- **Stop Loss:** For long trades, set the stop loss at the RED line below. For short trades, set it at the BLUE line above.
- **Take Profit:** For long trades, target the next RED line above. For short trades, target the next BLUE line below.
**Timeframe:**
Use a 5 timeframe for trading.
**Risk Disclaimer:**
This setup is for educational purposes. I'm not responsible for your gains or losses. Check the chart for more details.
NIFTY Midcap 100 Key Levels for 09/09/2024**Explanation:**
This trading system helps you avoid blind trades by providing confirmation for better entries and exits. It considers volume, past prices, and price range.
**Entry/Exit Points:**
- **Entry/Exit Lines:** Use the GREEN line for long trades and the RED line for short trades, based on confirmation from your trading plan.
- **Stop Loss:** For long trades, set the stop loss at the RED line below. For short trades, set it at the GREEN line above.
- **Take Profit:** For long trades, target the next RED line above. For short trades, target the next GREEN line below.
**Timeframe:**
Use a 5-minute timeframe for trading.
**Risk Disclaimer:**
This setup is for educational purposes. I'm not responsible for your gains or losses. Check the chart for more details.

NIFTYMIDCAP - Will it correct moreNifty Midcap. Whenever it reaches at the upper end of the channel, it corrects approx.10% within a span of 35-44 days in the last 2 occasions. This time again it reversed after touching the upper end of the channel and so far it corrected approx. 5%. Will it repeat this time also? so far it seems, yes.

Mid-Cap Index is the index to watch out for.As we have discussed in previous educational messages. By selecting the indices that are looking strong we can get a range of stocks that can do well. From that basket of stocks you can then further scrutinize and select the stocks that might preform the best based on charts and fundamentals of the companies.
This week let us look at the Mid-Cap index that took a dramatic beating and is finding a support from where it can regain lost ground and even surpass the recent highs. Midcap Index made a high of 51342 before the descend began. The index has taken a support at the mid channel which also happens to be a trend line support. If the support or the low of Friday which was 48605 is not broken then we will see the comeback of Mid-cap stocks and index.
Resistance levels for the Mid-Cap index going forward will be 49545, 50132, 50425, 50802 and finally the previous high of 51342. The channel top seems to be near 52399 if the highs of 51342 are broken and sustained in future.
Support levels for the Mid-Cap index in case the support at 48605 is broken will be near 47952 or 46928 which seems to be the channel bottom. Choose wisely from the Mid-cap stock basket while keeping an eye on the levels mentioned here. Happy Investing.


NIFTY MIDCAP wedge or Triangle pattern formationNIFTY MIDCAP wedge or Triangle pattern formation, If breaks any side movement will be higher.
keep in watchlist

are midcaps overvalued ? Time to exit ?this is a educational analysis of the midcap index were i share my opinion on were the index is heading

clear sell midcaps..there is a very likely correction in nifty mdcaps..targets are market..stay light
