Index To Watch Next Week: CNX Pharma Index. The index that did very well this week and which has potential to carry forward the momentum into the next week seems to be the CNX Pharma Index.
The pharma index looks strongly placed above Mother Line of 50 Weeks EMA line. The resistances it faces or can face if it moves upwards can be near 21667. If this trend line resistance is crossed, there is a possibility of Pharma index reaching 22117 or 22428 . 22428 will be a little tough to cross as it is the mid resistance of the parallel channel in which CNX Pharma index is travelling. If we get a closing above it, there is a real possibility for the index to reach 22715 or even 23K+ levels. The support for CNX Finance is the Mother and Father lines which are merged near 21144 and 21176 zone. If this major support zone is broken the index may fall to 20637 or 19628 levels.
To know more about Parallel Channels, Mother, Father and small Child Theory, Behavioural finance, Fundamental analysis, Technical analysis, Profit booking etc. Read my book The Happy Candles Way to Wealth creation. It is as on date one of the highest rated books on Amazon. The paperback version and Kindle can be bought through Amazon. You can also contact me to buy the same.
Now if this breakout actually happens in the Nifty Pharma index the some of the stocks that composites the Pharma Finance will be the beneficiaries. Some might benefit more some might benefit less and some might not benefit but for index to move upward the stocks composing it have to perform well. To know which stocks will do better than others we will have to look at their individual charts. The stocks which make the Nifty Pharma index are Sun Pharma, Mankind Pharma, Dr Reddy’s Lab, Auro Pharma, Lupin, Cipla, Glenmark, Ajanta Pharma, Biocon, Alkem, Laurus Labs, JB Chem Pharma, Granules, IPCA Labs, Abbott, Zydus Life, Natco Pharma, Gland Pharma, Torrent Pharma, Divi’s Lab. The Index Can Perform if the majority constituents or the stocks with heavy weightage perform. Some of these stocks can perform others might not. Choose wisely after consulting your investment advisor, studying fundamentals and Technicals of each company.
Disclaimer: The above information is provided for educational purpose, analysis and paper trading only. Please don't treat this as a buy or sell recommendation for the stock. No one can guarantee any success in highly volatile market or otherwise. There is also chance of bias in our opinion. The supports and resistances indicated are based on data which has a cycle time of being 3 months or older so it is not necessary that it will work. The author or Smart Investment will not be responsible for any Profit or loss that may occur due to any financial decision taken based on any data provided in this message.
CNXPHARMA trade ideas

25-JAN-2025 PHARMAPAHRMA Sector Trading Near swing low formed in recent period and PHARAM is not in down trend but nifty clearly down trend

Nifty Pharma Sellweekly time period nifty pharma start wave 4 downside . 3 to 4 month correction start index

Flag pattern Breakout in Pharma IndexIndices are far more reliable during technical analysis as compared to the individual stocks.
The pattern is a clean one in Nifty Pharma Index.
This is to spread the awareness about technical chart patterns and not a buy/sell recommendation.
Always do your own research before making any financial decision.


Index to watchout for next week: Pharma Index. For the past few weeks we have been trying to understand how to use the performance of an index reflects in performance of stocks that are constituents of that particular index and vice versa. By catching the index that is on the verge of breaking out or has broken out during the week, we can plan our investment and trades around it to maximize our returns. We spoke about Bank Nifty, then IT Index. Both gave considerable returns in the last 2 /3 weeks. The index that look most interesting this week end is Pharma Index.
Pharma index has given a powerful breakout and has closed above very important fibonacci resistance (20380) this week. The closing of Pharma index this week was 20453.85. The next 2 Fibonacci resistances for Nifty will be at 21013 and 21475. Supports for the Pharma index remain at 19936 and 19397. 19397 is a mega support which has a combined power of Fibonacci, Mid-channel and 50 days EMA.
The stocks that constitute the Pharma index are: Lupin, Dr.Reddy's Lab, Torrent Pharma, Alkem Lab, Biocon, Divi's Lab, Sun Pharma, Cipla, Zydus Life and Aurobindo Pharma. Some Peripheral Pharma stocks can also be looked at for investment purpose. We are not giving a buy or sell call on any of these companies. This is just an educational article explaining the potential moves of Pharma Index, how it can move in either direction and what can be the technical reasons behind the same.
Disclaimer: There is a chance of biases including confirmation bias, information bias, halo effect and anchoring bias in this write-up. Investment in stocks, derivatives and mutual funds is subject to market risks, please consult your investment advisor before taking financial decisions. The data, chart and other information provided above is for the purpose of analysis and is purely educational in nature. The names of the stocks or index levels mentioned in the article are for the purpose of education and analysis only. Purpose of this article is educational. Please do not consider this as a recommendation of any sorts.

NIFTY Pharma is ready for 25% upmoveWeekly Chart Analysis
NIFTY (Pharma is out of bound after 3 months of consolidation.
Mirror move of a previous swing (Notably 3rd Elliot wave count) leads to 24k+ levels.
One can pick up quality stox in pharma for next up moves.


CNXPHARMA - Trend Reversal 📊 Script: CNXPHARMA (NIFTY PHARMA)
Key highlights: 💡⚡
📈 Nifty Pharma is retesting from its support level shown in chart.
📈 Pharma stocks can give good returns.
📈 One can go for Swing Trade into Pharma stocks.
📊 Script: CIPLA
⏱️ C.M.P 📑💰- 1414
🟢 Target 🎯🏆 - 1510
📊 Script: LUPIN
⏱️ C.M.P 📑💰- 1688
ONLY ABOVE 1700
🟢 Target 🎯🏆 - 1828
📊 Script: AUROPHARMA
⏱️ C.M.P 📑💰- 1177
🟢 Target 🎯🏆 - 1267
📊 Script: GLAND
⏱️ C.M.P 📑💰- 1177
🟢 Target 🎯🏆 - 1267
📊 Script: BIOCON
⏱️ C.M.P 📑💰- 1177
🟢 Target 🎯🏆 - 1267
⚠️ Important: Always maintain your Risk & Reward Ratio.
✅Like and follow to never miss a new idea!✅
Disclaimer: I am not SEBI Registered Advisor. My posts are purely for training and educational purposes.
Eat🍜 Sleep😴 TradingView📈 Repeat 🔁
Happy learning with trading. Cheers!🥂

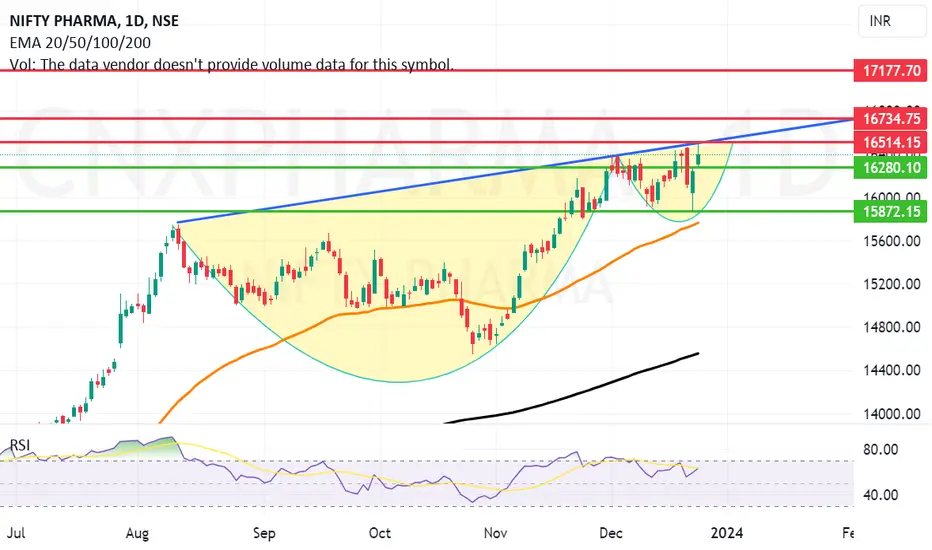
Cup and Handle kind of Breakout on cards for Pharma Index. Technically Pharma index is on the verge of giving a cup and handle like breakout in addition to news of new COVID variant making waves. The Pharma index also looking very buoyant. If this particular index can give a closing above 16515 there can be an upsurge 16734 or even 17177 levels taking the index constituents higher along with it.
Major companies in pharma index are Abbott, Cipla, Glaxo, Sanofi, Pfizer, Dr Reddy's, Lupin, Torrent Pharam, Ipca Labs, Sun Pharma, Aurobind Pharma, Natco Pharma, Granules India, Gland Pharma, Alkem, Biocon, Glenmark, Zydus Lifescience, Divi's lab, Laurus lab. Some companies good companies of Mid and Small cap pharma can also yield positive momentum.
Post identification of a strong index what you can do is try to look at the charts of each constituent of the index individually and select the stocks with best EPS, PE ratio, Good Cash flow from operations, Revenue and Net Profit growing year on year and quarter on quarter.
Remember that now all the stocks in an index will move equally some will move faster, some will move at the same pace, some will move slowly and some will not move at all or move negatively. You have to be smart in selection of your stocks from the particular index and you will surely be able to beat the market and Ace the art of investing. There are many Pharma related Mutual funds that can also be looked at.
Disclaimer:
Investment in stocks and mutual funds is subject to market risks, please consult your investment advisor before taking financial decisions. The data provided above is for the purpose of analysis and is purely educational in nature. The names of the stocks given in the above article and chart of IT Index is only for analysis. Purpose of this article is educational. Please do not consider this as a recommendation of any sorts.
CNX PHARMA - BIG BREAKOUT ON THE WAYGlenmark recommended earlier at 479 did 835 within 3 months.
Strides Pharma recently recommended at 310 and again at
and Many more
Some Stocks that I like
1. Ajanta Pharma
2. Kopran
3. Lincoln Pharma
4. Strides Pharma

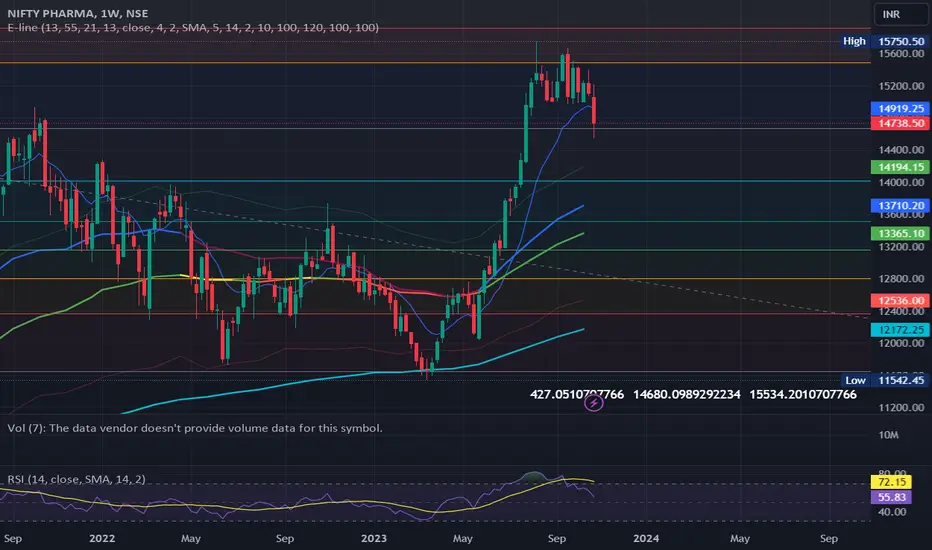
NIFTY PHARMA INDEX : EILLOT WAVE + FIBO RETRACEMENT / PROJECTIONNIFTY PHARMA index shows very interesting FIBO retracement and FIBo projection confluence.
The FIB retracement is drawn from 11542 to 16385 shows levels of 15242 - 14535 , while the projection from 11542 to 12688 and placed at 12040 shows projection of 13236 - 14550 - 15994.
The FIBo level for both meet near 14550 indicates strong support area.
The Eillot wave count is as shown in the chart indicates completion of implusive waves. The candle stick patterns also indicate weakness.
So long a new peak is not formed with break of 16385 , we may observe this weakness in coming days.

Pharma Sector and its components Daily Timeframe AnalysisPharma Sector and its components are in correction phase
NSE:CNXPHARMA sectors NSE:DIVISLAB , NSE:SUNPHARMA , NSE:DRREDDY have created same structure as NSE:NIFTY
NSE:DIVISLAB , NSE:SUNPHARMA , NSE:DRREDDY daily candle close below level.
We can see all targets along with NSE:NIFTY , $NSE:CNXMETAL.
Disclaimer - All information on this page is for educational purposes only,
we are not SEBI Registered, Please consult a SEBI registered financial advisor for your financial matters before investing And taking any decision. We are not responsible for any profit/loss you made.

Pharma index new breakoutPharma index new breakout after a year of consolidation above 15000..
target 30,000 till 2025-26.
most of the Pharma stock will rally


cnxpharma longpharma sector make a pol and flag pattern in big time frame. now sector showing good volumes. may be upcoming weeks we see a breakout and see big moves

CNXPHARMA : Expecting a slow reversalFrom a price action perspective there is a higher probability for the pattern to repeat and a slow reversal move to happen. This might take months to happen.
Until price reached the low of the channel line as per my view, I'll not dare to take an entry in the sectoral ETF.
Sometimes the pattern might evolve for sure but until that happens my view stays the same.

Nifty Pharma breakout.Nifty Pharma had failed to close above 14800 on the weekly chart on two occasions in 2021. Has finally given a breakout and close above the level this week.
Keep an eye on pharma stocks.
❤ & follow for more.

NIFTY PHARMA - Trendline BreakoutNifty Pharma can be seen making clear trendline breakout and also retest stands complete, looks good for long, as long as it stays above trendline.

Review and Trading plan for 22nd May 2023Nifty future and banknifty future analysis and intraday plan in kannada.
This video is for information/education purpose only. you are 100% responsible for any actions you take by reading/viewing this post.
please consult your financial advisor before taking any action.
----Vinaykumar hiremath, CMT

NIFTYPHARMA at major SUPPORT LEVEL#CNXPHARMA The next sector to focus on!
The relative Strength chart of #CNXPHARMA/#NIFTY50 is currently at channel support. Index is at major support as well
KEEP PHARMA STOCKS ON YOUR RADAR

CNXPHARMA - Weekly AnalysisIn the Weekly Chart of CNXPHARMA ( Nifty PHARMA ),
we can see that, 3 week of up move with Strong Candles.
Let Pharma Stocks Retest for 1 or 2 week, Then We can se a more Stronger move.
