DABURStock name = Dabur India Limited.
Weekly chart setup
Chart is self explanatory. Levels of breakout, possible up-moves (where stock may find resistances) and support (close below which, setup will be invalidated) are clearly defined.
Disclaimer: This is for demonstration and educational purpose only. this is not buying and selling recommendations. I am not SEBI registered. please consult your financial advisor before taking any trade.
DABUR trade ideas

TRADE_SETUP_DABUR 10% MOVE IS STARTING NOW!This FMCG stock is spotted completing a complex triple three(WXYXZ)correction to a prior leading diagonal wave 1 that it had developed between October-Dec.2023.
The stock has made a 50% retracement of the 'wave 1' rise during the complex correction in the past three weeks.
Now that the corrective wave is nearing its end(or already ended), the stock should be expected to make a ''U-turn" from current levels and should attempt to move towards the INR 580 mark in coming weeks/months.
INR 520 can be used as an "SL" on the downside.
At current levels, the stocks offers an attractive risk reward of 1:5 for a short term trade.
Note*- Views are based on personal opinions/observations. Please do your own research before making any trading/investing decisions.

Dabur - Bullish ViewDabur - Elliott Wave Count
The market has begun the bullish after the wolfewave with the target of 650 and above. its suggested to wait for correction to take long position for a good price. wave E should be the SL for the long trade.
Please note that this information is for educational purposes only, and it is crucial to trade with caution.
NSE:DABUR BSE:DABUR NSE:DABURZ2023

demand and supply zones of DABUR RED ZONE shows the supply and GREEN ZONE shows the demand. The stock is trading in this range since a long time. We can make a position in this range when the prices are near the zones. If these important zones are breached then we can see a big move!!!!

Dabur India weekly Support and pin bar combination Fundamental stock at weekly support and bounce back.
Exact Pin bar and next close above the pin bar.
50 % position now And another 50% at better price, So stop loss could be small.

DABUR - BULLISH - ELLIOTT WAVE VIEWDabur is in start of 3rd wave again? Keep an eye on this. After giving a WXYXZ decline, It formed wave 1-2 as expanded Flat formation, and the next wave 1-2 is coming to an end. Now anytime 3rd wave can start.

RETEST COMPLETIONPrice has been tested around 0.5 Fibannocci levels and if it closes today strongly and i target it to the trendline drawn on 21062023 in the given chart.
However, stock has got a high PB and PE ratio.
Please provide your views if anything which i might have missed out.

DABUR Stock market lower low lower high formation it means stock in a downtrend.
Moving averages and lagging and leading indicators give a bearish signal.
Also today came a bad news for stock.
Stock is very week formation for long, 200 DEMA for last hope to support and bounce back.
Disclaimer this is my personal view for education purpose only.
DABURDabur greatly gained strenth, with immediate stop of 544, it seems more reliable to enter.
No specific target, trial a stoploss
trade at your risk, if you get benefit out of this, then feed a little a poor. thanks

Dabur technical AnalysisHi every one
future or
call option 620 CE july August trade karo
Share buy karo


Unleashing Dabur's Potential: A Bullish Journey to New HeightsA meticulous examination of Dabur's current market conditions, encompassing both technical and fundamental analyses, foretells a promising trajectory for the stock. The convergence of these analyses leads to an astute forecast of an imminent bullish movement, suggesting a potential surge towards the significant target levels of 697 and 755. Through an integration of sophisticated technical indicators and a profound comprehension of the underlying fundamentals, this analysis unveils a compelling outlook for Dabur's stock performance.
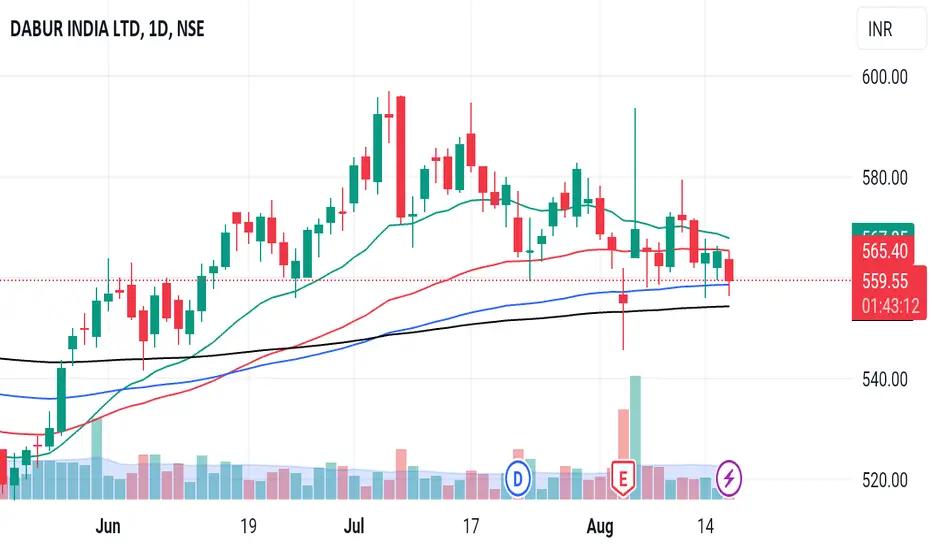
Delving into the technical analysis, multiple indicators align harmoniously to suggest an upward trend. The stock's current trading price of 565.40 is situated in a favorable position, poised to initiate a substantial upward momentum. A meticulous examination of the price chart reveals robust support levels, affirming the viability of a bullish breakout. Additionally, the convergence of key technical indicators, such as moving averages and relative strength index (RSI), underscores the increasing buying pressure and the potential for a sustained rally. These indicators, when considered in tandem, provide a solid foundation for an optimistic forecast, with Dabur's stock primed to ascend towards the anticipated levels of 697 and 755.
Moreover, the comprehensive fundamental analysis of Dabur further bolsters the optimistic outlook. Dabur, a renowned consumer goods company, boasts a strong financial position, characterized by consistent revenue growth and robust profitability. The company's prudent strategic initiatives, coupled with its diversified product portfolio, position it favorably in the market. Furthermore, Dabur's commitment to innovation and investment in research and development (R&D) fosters a sustainable competitive advantage, further propelling its growth potential.
Considering the macroeconomic factors, the current market conditions are conducive to Dabur's bullish movement. With a favorable economic environment and rising consumer spending, the demand for consumer goods is anticipated to experience an upswing, thereby benefiting Dabur's stock performance. Additionally, the company's strong brand equity and extensive distribution network contribute to its ability to capture market share and capitalize on emerging opportunities.
In conclusion, the meticulous analysis of Dabur's stock using both technical and fundamental approaches yields an affirmative forecast of a forthcoming bullish surge. The convergence of key technical indicators and the company's robust fundamentals contribute to this positive outlook. As the stock trades at 565.40, investors can anticipate a potential ascent towards the target levels of 697 and 755. With a favorable market environment and Dabur's inherent strengths, the stock holds the potential for substantial capital appreciation, making it an attractive proposition for investors seeking to capitalize on this upward momentum.

harmonic pattern formed in Daburharmonic pattern formed in Dabur,
first target will be 575 and second target will be 600

DABUR - Weekly AnalysisIn the Weekly Chart of DABUR ,
we can see that; it is forming a Big Cup & Handle with strong Price Action.
It has retested from W Pattern breakout.

DABUR : AnalysisCMP : 542, Breakout On Daily Timeframe Trendline. Buy around 530 Levels, Stop Loss Should Be The Black Trendline On Closing Basis.
Disclosure : Just Analysis for Future Reference. Not a Prediction.

Dabur making hammer candle near trend line on monthly chartMade hammer candle on monthly chart near trend line.
Trading here has a godd risk riward ratio.

Dabur short term Swing stocks Not a call just a view
No pattern breakouts or retracement
Just i will buy above the blue price trading near EOD closing

Dabur India Ltd perfect time to buyNSE:DABUR
It's the 2nd touch down of the price action to the 200 EMA. Easy 12-15% gains from here within 4 months. Green rectangle is the perfect area to buy.
At the last touch down to 200 EMA we saw a 20% gains within 2 months.
*Not a financial advice.
My charts speaks louder than words.
I'm a chartist and I paint charts.

Dabur india for intraday Hello traders i hope you are doing well. Today i will share u dabur India analysis for tomorrow morning.

Dabur weekly Uptrend possibleHi every one
Dabur best leval par aya hai
You can plan daburindia for investment or Trading becuase weekly chart par leval par aya hai
must watch Call and Stock

DABUR Swing IdeaDabur can be good to buy and keep it near its support And when it comes near 600, you can sell it.


