Dabur 1wtfLook like a good upside opportunity and need of opening above the previous week's high and close of coming week's candle and target moves as mentioned in the charts
DABUR trade ideas

Dabur :- Rally is about to come ! Keep on track ! Fmcg bullish ! Dabur share breakout done & enter at pullback ( CMP ) Target on the chart ! SL candle low or 560 for safe ! Fmcg sector bullish & dabur India looking strong & all indicators are showing bullish sign ! There is no sign of bearish ! Go long ! It's also fundamentally strong ! Hold few months for quick 15 to 20 percent !!

Dabur Dabur is having a good retracement. Will hit the target as per the trend
Disc: Not a buying recommendation. Only for Learning purpose

DABUR InvestmentGiven a breakout..so buy one lot here...a second lot mentioned on the chart and keep a3rd lots money on the side for emergency IF dabur falls down more further

DABUR INDIA DABUR INDIA - Momentum buildup
Watch how RSI is gaining momentum, while price is consolidating. Upon breakout, it can prove to be a good case of bullishness.
entry - 520 daily close
SL - 492
Target - 540 and above
DABUR is trading at a favourable PE. I would recommend to add in cash and keep as a medium term pick. 600 levels are easy here, within 4 months.


DABUR- DB pattern and consolidation , Opportunity for LONG.
Notice the DB Pattern with Price making Equal LOW.
Volume confirmation wth Bullish Green Candle is seen on 31st MAY>
Price is near to 23% FIB RES.
Likely to consolidate near 480 and 530 region
Best Buy neat 500-510.
Probability of consolidation is high.
Happy Trading and Happy Investing.

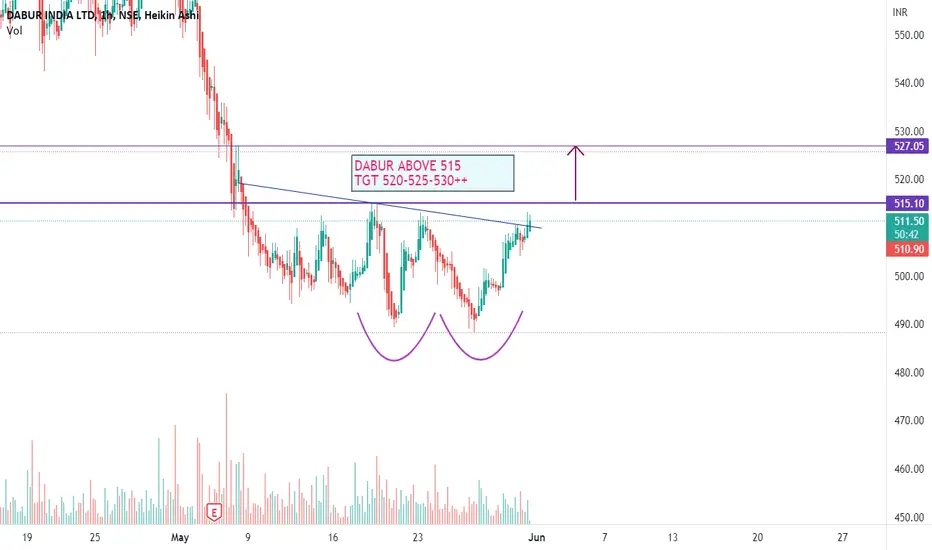
MY view on DABURDabur looking good.It can give soon breakout above 515.Above 515 target 525-530 in very short term.We are keeping on radar DABUR 520 CE.
DABUR DABUR - Confluence of POC support accompanied by weekly 200 ema support
One can go long with a strict SL of this week's low or 200 ema.
FNO data is positive.
Dabur IndiaSun Storm Investment Trading Desk & NexGen Wealth Management Service Present's: SSITD & NexGen Portfolio of the Week Series
Focus: Worldwide
By Sun Storm Investment Research & NexGen Wealth Management Service
A Profit & Solutions Strategy & Research
Trading | Investment | Stocks | ETF | Mutual Funds | Crypto | Bonds | Options | Dividend | Futures |
USA | Canada | UK | Germany | France | Italy | Rest of Europe | Mexico | India
Disclaimer: Sun Storm Investment and NexGen are not registered financial advisors, so please do your own research before trading & investing anything. This is information is for only research purposes not for actual trading & investing decision.
#debadipb #profitsolutions


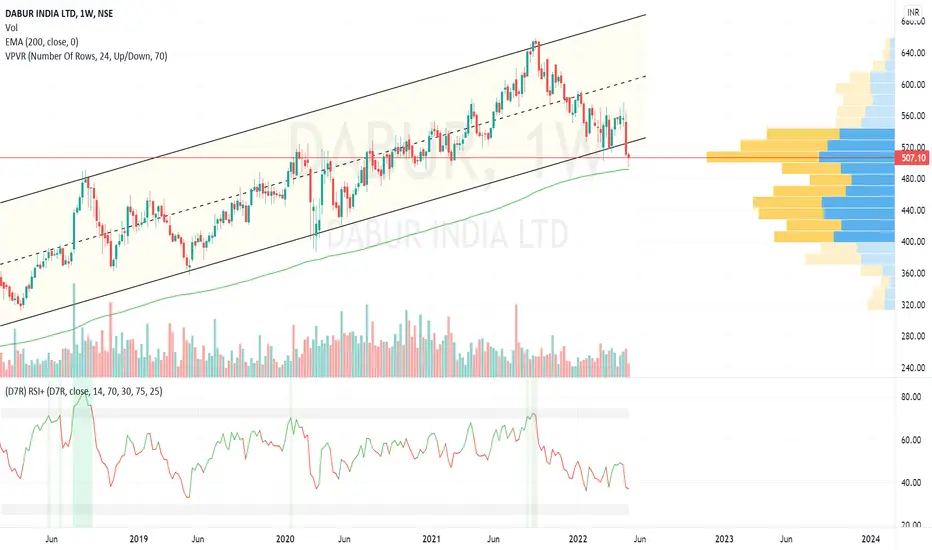
#DABURDabur has never fallen below its 200 ema in weekly or above charts.
Dabur has been in a uptrend since 8 years

DABUR HOURLY ANALYSISGoing long if support sustains for an hour. Target will be 61.8% on fibo which is 561, SL will be 552

DABURDabur Ltd is an Indian multinational consumer goods company, founded by S. K. Burman and headquartered in Ghaziabad. It manufactures Ayurvedic medicine and natural consumer products, and is one of the largest fast-moving consumer goods companies in India

dabur stock near breakout levelif it will break 566 level then we can see a good upmove. It has created a ascending triangle.

Dabur IndiaEducational Purpose Only
My View & Technical Analysis
Like 👍 for More Free Chart Analysis.
Comment 🤳 your stock for My Analysis.

Simple Trade Setup | DABUR | 18-04-2022 [INTRADAY]NSE:DABUR
Observations:
1) On 1day time frame, we can see resistance channel.
If it gives breakout of this channel then we can see a good up move.
Also level 560 is immediate breakout level.
Please refer below chart : 1day time frame.
2) On 15min time frame, we can see short term support channel and long term resistance channel.
Please refer below chart : 15min time frame.
-------------------------------------
Trade Setup for 18-04-2022
1) Don't Jump in to trade at the beginning of the market. Let it get settle for 15-20min first and judge the price action.
2) Everything is mentioned on the chart. I hope it is easy to understand.
3) All the levels will work as support, resistance, entry and exit w.r.t price action near that level.
4) Avoid gap up or gap down chase. Wait and trade between levels.
Please refer below chart for levels.
Hope I made it easy to understand it.
Do comment your doubt or suggestion.
Note: Trade with Strict SL. It may or may not hit all the levels. So one can book profit / loss at respective level considering how price action works near that level.

DaburDabur broke out of symmetrical triangle on an hourly chart with okayish kind of volumes.
Could be both with mentioned stoploss & targets.

DABUR LONGDABUR LONG
Rounding bottom near the strong support levels.
Expecting upmove.
No recommendations.

DABURNSE:DABUR
please note that we are not a SEBI Registered Investor Adviser/PMS/ Broking House.
All the contents over here are for educational purposes only and are not investment advice or recommendations
offered to any person(s) with respect to the purchase or sale of the stocks / futures and options.
You are also requested to apply your prudence and consult your advisers in case you choose to act on
any such content available as WE claims no responsibilities for any of your actions or any outcome of
such action


DaburDabur is facing resistance @ 570 level from past 2 trading sessions, it broke 570 level today with decent kind of volumes.
Could be bought with mentioned stoploss & targets.

DABURNSE:DABUR
please note that we are not a SEBI Registered Investor Adviser/PMS/ Broking House.
All the contents over here are for educational purposes only and are not investment advice or recommendations
offered to any person(s) with respect to the purchase or sale of the stocks / futures and options.
You are also requested to apply your prudence and consult your advisers in case you choose to act on
any such content available as WE claims no responsibilities for any of your actions or any outcome of
such action
