DRREDDY UPSIDE POSSIBLEI would not be able to able to explain this chart this time but according to me the chart looks pretty self explanatory.
Please LIKE, COMMENT and SHARE to motivate and support me. I'll keep on posting new ideas on Indices & Stocks. Be sure to follow so that you don't miss any good trades that might have been rewarding.
Any comments and critiques will be appreciated even if it's of opposite view as a trader can also be right so many times.
DRREDDY trade ideas

Dr Reddy (Long)Dr reddy is a buy
Rest all levels are given on the chart
Must Correlate yourself also on charts. This is for educational purpose only. Must consult your financial advisor before investing.

100EMA,200EMA,400EMA CROSSOVER ON 30MINHi Trading View Family, Today I have found very intersting chart of DR REDDY, here we can see that on 30min TF we have found 100EMA,200EMA crossing each other when 100EMA cross 400EMA ,We can generate a buy,As100EMA,200EMA,400EMA is forming straight line on chart and then crossing which shows that price has been consolidate and now can go away from MOVING AVERAGE to give movement.So a high probability buy signal will be triggered when 100EMA CROSSES 200EMA,400EMA, and target of 1:2 can be achived.


DR.Reedy's at support line.Dr. Reddy's may give up move. Target - 5500
Hedging Idea -
Buy Dec Fut at - 4849
Buy Dec 4800 PE
Max Loss - 24731
Est. Profit - 62000
Margin Needed - 54000
TIME - 1.5 MONTH
Return - 115%
Tip. First buy put then buy future. PE will decrease your margin need.

PERFECT CYPHER PATTERNMARKET ANALYSIS: Market has formed Perfect Cypher Pattern. Once it s valid Buy starts, probably may hit our targets soon. So lets wait !!


Dr reddy Looks good above 4690 upside targets on chart
If reversal incase downside level mentioned on chart... Stock looks bullish from here

DR REddy Buy for day tradingdr reddy stock make inverted head and shoulder pattern and its bullish chart pattern if the stock show strong then we will buy this stock for day trade

Dr Reddy's LabHello and a warm welcome to this technical outlook on Dr Reddy based on Harmonic Patterns.
In daily time frame it has made a Bullish Harmonic Cypher suggesting an up move possible till 4800/5000 with a stop loss at 4500.

Long $DRREDDY CMP ₹4958.70Long $DRREDDY CMP ₹4958.70. Testing resistance. Failed to follow thru last time. Mini cup and handle pattern. Earning expectation could take price back to previous highs. Resistance ~₹4972 Target 1 ~₹5436 Target 2 ~₹5594 Stop Loss ~₹4824

DR REDDY LABDisclaimer - This idea is only for educational purpose and I will not be liable for any profit/loss that you might incur.
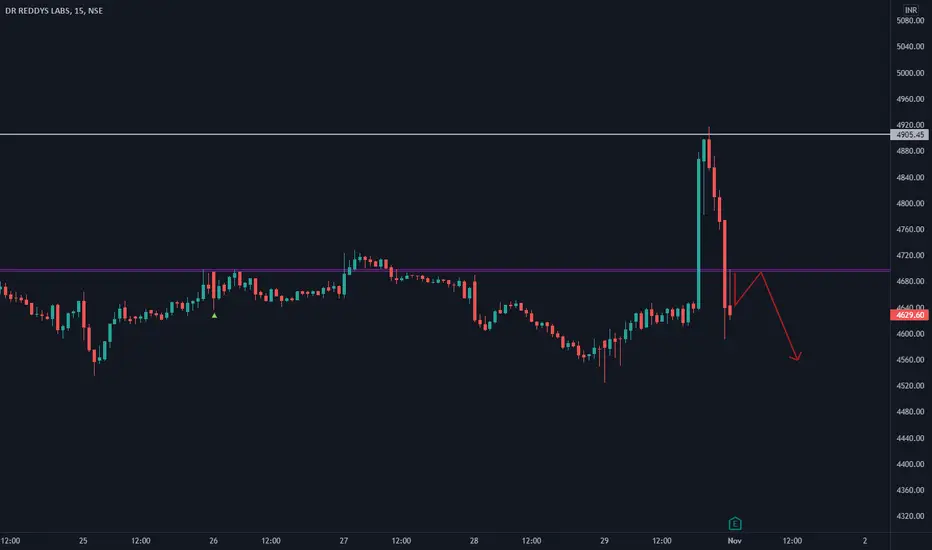
Dr . Reddy fell from 5615 to 4440. Its since then retracing and faced rejection from 50% area, but while retracing it has made a rising wedge pattern and also given a break down on daily as well as hourly time frames. In my opinion it might test 4600 levels again before going up. So this is a good shorting opportunity.
Stoploss shouldn't be above '4975'


DRREDDY- Probable AB=CB CompletionProbable AB=CD completion. Long position can be taken for below target.
PRZ= 5256 to 5371
Target= 5256
CMP=4958

DRREDDY LOOKING BULLISH ABOVE 4910 DRREDDY Looking Bullish Above 4910 if sustain above on closing basis Will Touch 5500 In Coming Days

DR REDDY - POC assited reversal of polarityOn Thursday, the stock formed Gravestone doji with high volumes.
But on the last day, the bears have been negated since fresh demand has come into place at the POC.
Good price to enter, with stop loss as the red line.
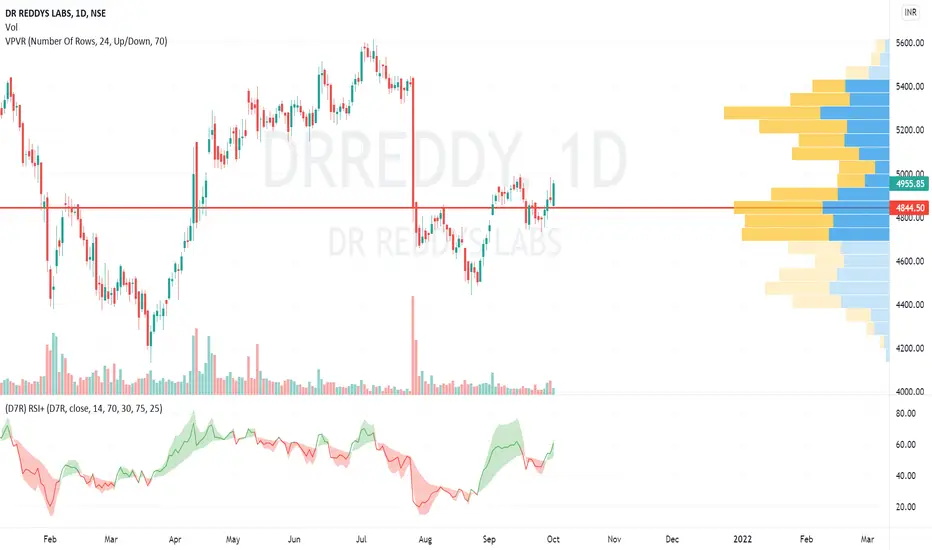
DR REDDY BOOK PROFITS.DRREDDY on weekly charts macd divergence and double top , book profits and wait for few years for good price.

Dr Reddy - LongAfter the big fall on 27.07.21. Some buying interest seems to comming in the stock. If it is able to hold 4745 in all probability will resume uptrend

DRREDDY#tradethepattern
3% is the target, which ever side price breaks
Can take swing for 3% or better try Intraday for better returns (coz of leverage i meant)

drreddy long for 5 to 10 daysdrreddy
(i) crosses 44 ma at day candle
(ii) crosses 38.08% golden ration of fib retracement and there is an probability of archiving 61.80%

Drreddy - Elliott wave analysis - ABC zigzag in Y wave expecting ABC zigzag as the part of (B) wave up - small upside followed by pull back as B and then one more push higher to finish C of (B)

13% move possibleReddy's could move up the channel, if the last candle on weekly charts is any indication to go by - a 13% move until 5610..CMP - 4912. Let's see.
