SWING IDEA - RATNAMANI MET AND TUBRatnamani Metals & Tubes, a leading manufacturer of stainless steel and carbon steel welded pipes and tubes, is showing a potential swing trade setup with several bullish technical signals.
Reasons are listed below :
3800 Zone Break Out : The 3800 level has acted as a strong resistance zone. The price is now breaking through this level, signaling the possibility of a continued upward move.
Bullish Engulfing Candle on Daily Timeframe : A bullish engulfing candle indicates strong buying interest, suggesting momentum may continue.
Trading Above 50 and 200 EMA : The stock is trading above both the 50 and 200 exponential moving averages, indicating overall bullish strength and long-term trend support.
Intact Trend : The broader trend remains intact, indicating that the current momentum is in line with the stock’s longer-term trajectory.
Gradual Increase in Volumes : A steady rise in volumes adds confirmation to the breakout, showing strong market participation in this move.
Target - 4270 // 4800
Stoploss - daily close below 3400
DISCLAIMER -
Decisions to buy, sell, hold or trade in securities, commodities and other investments involve risk and are best made based on the advice of qualified financial professionals. Any trading in securities or other investments involves a risk of substantial losses. The practice of "Day Trading" involves particularly high risks and can cause you to lose substantial sums of money. Before undertaking any trading program, you should consult a qualified financial professional. Please consider carefully whether such trading is suitable for you in light of your financial condition and ability to bear financial risks. Under no circumstances shall we be liable for any loss or damage you or anyone else incurs as a result of any trading or investment activity that you or anyone else engages in based on any information or material you receive through TradingView or our services.
@visionary.growth.insights
RATNAMANI trade ideas

RATNAMANI : Liquidity and Wave Patterns AlignHeadline: Liquidity and Wave Patterns Align – Strategic Buying Opportunity
Technical Analysis:
Structure: The price action has retraced into the deep retracement zone of 113%-127% Fibonacci extension of the last swing. This zone often attracts liquidity and signals potential reversals.
Wave Structure: Elliott Wave count suggests completion of an extended Wave C . A bullish reversal is anticipated from this level, aligning with the liquidity zone.
Key Levels:
Buy Zone: ₹3,263-₹3,310
Stop Loss: ₹3,202 (Below the liquidity zone and extended Wave C completion)
Target 1: ₹3,817-₹3,875
Target 2: ₹4,054-₹4,146
Educational Notes:
Fibonacci Extensions: The 113%-127% zone is a common reversal area for corrective waves.
Wave C Completion: This marks the end of a corrective phase, transitioning into a new impulsive trend.
Disclaimer:
This is for educational purposes only. Trade with appropriate risk management and do your own analysis before taking any positions.

RATNAMANI S/RSupport and Resistance Levels:
Support Levels: These are price points (green line/shade) where a downward trend may be halted due to a concentration of buying interest. Imagine them as a safety net where buyers step in, preventing further decline.
Resistance Levels: Conversely, resistance levels (red line/shade) are where upward trends might stall due to increased selling interest. They act like a ceiling where sellers come in to push prices down.
Breakouts:
Bullish Breakout: When the price moves above resistance, it often indicates strong buying interest and the potential for a continued uptrend. Traders may view this as a signal to buy or hold.
Bearish Breakout: When the price falls below support, it can signal strong selling interest and the potential for a continued downtrend. Traders might see this as a cue to sell or avoid buying.
20 EMA (Exponential Moving Average):
Above 20 EMA(50 EMA): If the stock price is above the 20 EMA, it suggests a potential uptrend or bullish momentum.
Below 20 EMA: If the stock price is below the 20 EMA, it indicates a potential downtrend or bearish momentum.
Trendline: A trendline is a straight line drawn on a chart to represent the general direction of a data point set.
Uptrend Line: Drawn by connecting the lows in an upward trend. Indicates that the price is moving higher over time. Acts as a support level, where prices tend to bounce upward.
Downtrend Line: Drawn by connecting the highs in a downward trend. Indicates that the price is moving lower over time. It acts as a resistance level, where prices tend to drop.
RSI: RSI readings greater than the 70 level are overbought territory, and RSI readings lower than the 30 level are considered oversold territory.
Combining RSI with Support and Resistance:
Support Level: This is a price level where a stock tends to find buying interest, preventing it from falling further. If RSI is showing an oversold condition (below 30) and the price is near or at a strong support level, it could be a good buy signal.
Resistance Level: This is a price level where a stock tends to find selling interest, preventing it from rising further. If RSI is showing an overbought condition (above 70) and the price is near or at a strong resistance level, it could be a signal to sell or short the asset.
Disclaimer:
I am not a SEBI registered. The information provided here is for learning purposes only and should not be interpreted as financial advice. Consider the broader market context and consult with a qualified financial advisor before making investment decisions.

Breakout on Cup wity Handle Pattern...NSE:RATNAMANI trade at 3645. Support is @ 3300. Resistance is @ 3900
When stock break its Resistance Level, You can watch it Next Resistance at 4500-4600 Level.

Go long - swing pick- this stock shows signficant delivery percentage value
- possible chances for accumulation
- may perform good in upcoming days
- line marked in chart is the day it showed huge delivery percentage.i consider it as signal candle.i marked its high and low
entry
- go long with 1:1.5 RR
- take entry if 15min close crosses the line , ignore entry if it made gap ups
sl
- candle close below signal candle's low
target
- keep 1.5 times of sl.

Ratnamani can benefit many if it closes above Mother Line.Ratnamani Metals & tubes Ltd. is a company manufacturing pipes and tubes of Mild steel, Stainless steel, Alloy steel as well as Titanium welded tubes. They also provide anti-corrosive coating solutions for pipes in addition to induction bending solutions.
Negative aspect of the company is that Mutual funds are decreasing stake and net cash flow is on a decline. PE ratio of the company is 37.2 which is a bit on the higher side. Positive aspects of the company are low debt and Zero promoter pledge.
Entry in the stock can be taken after closing above 3318. Targets will be 3440 and 3546. Long term target in the company will be 3652. Stop loss should be maintained in the stock at a closing below 3242.
The above information is provided for educational purpose, analysis and paper trading only. Please don't treat this as a buy or sell recommendation for the stock. We do not guarantee any success in highly volatile market or otherwise. Stock market investment is subject to market risks which include global and regional risks. We will not be responsible for any Profit or loss that may occur due to any financial decision taken based on any data provided in this message.


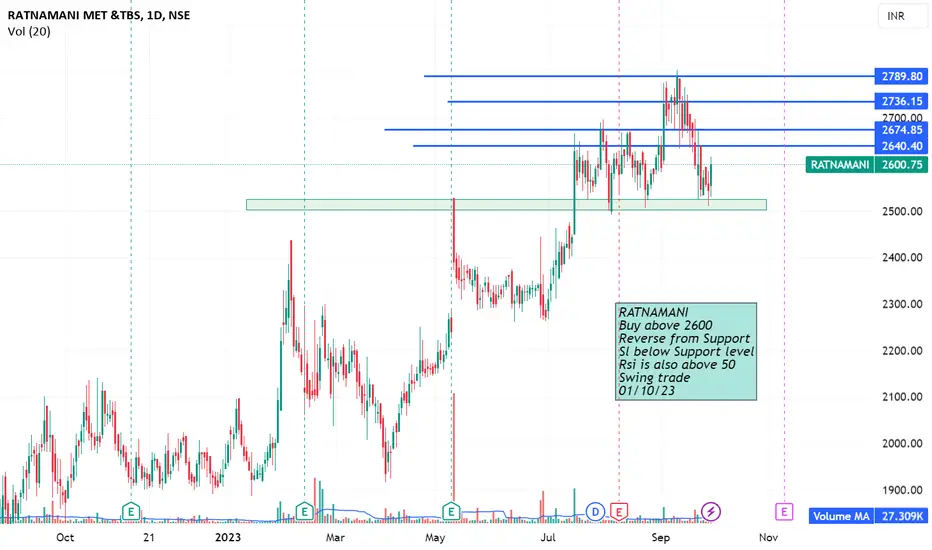
RATNAMANIRATNAMANI
Buy above 2600
Reverse from Support
Sl below Support level
Rsi is also above 50
Swing trade
01/10/23
Cup and handle Ratnamani metals weekly chart : perfect cup and handle pattern.......companies ROCE is around 27 and ROE 21% with almost debt free ..... price to book is around 6.5

RATNAMANIRATNAMANI - CMP 1996.45
In Scope Details
Breaking Out the Triangle pattern which has three resistance
Risk would be less
Higher time frame it looks too good
Immediate stop would be 1881
Trade at your own risk, if you are benefited out this analysis, plz feed a poor.
Plz share and comment your thought if any. thanks

RATNAMANI Swing opportunity.Ratnamani swing opportunity in on daily TF.
CMP - 2220
Target - 2350
if any doubt please ask it.
keep support me.
For educational purpose only.
i am not sebi registered.
Do your own analysis.
Please consult your financial advisor.

RATNAMANI MET & TBS Positive BreakoutRATNAMANI MET & TBS Positive Breakout for information see in chart
Note:- this is not a call or recommendation. I'm not responsible for your profit or loss

Ratnamani Metals BreakoutThe stock has broken out and retested, therefore may undergo a reversal rally. Trade is supported by Supports Nearby.
Risk Reward Ratio - 2:1
SL is placed below the support zone & the lower trendline. The target is placed near resistance.

Ratnamani Metals BreakoutThe stock has broken out and retested, therefore may undergo a reversal rally. Trade is supported by Supports Nearby.
Risk Reward Ratio - 2:1
SL is placed below the support zone & the lower trendline. The target is placed near resistance.

Ratnamani long .. cup handle chart is giving cup handle pattern
long after breakout of 2240
can be potential upside for 10 to 15 %
will update once breakout happens
happy trading,
Samkit Jain

Ratnamani Metals ReversalThe stock has reached lower trendline and may undergo a reversal rally. Trade is supported by brokerage calls and Supports Nearby.
Risk Reward Ratio - 2:1
SL is placed below support zone & the lower trendline. The target is placed near resistance.

Ratnamani metals and tubes - looks good for Swing tradeBuy at CMP
TGT
2340
SL
2098
Only for educational purposes >>>
#technifty

RATNAMANI Metals perfect breakoutRatnamani Metals gave a perfect breakout today of cup with handle pattern. All levels on the chart. This is a good stock for medium term. Accumulate it on dips.

Ratnamani Metals - Steel set to become hot above 1015Ratnamani metals seems interesting at a breakout level.
The valuation has been corrected back to 20 P/E that is at 2014 levels.
Market cap/sales is at 1.7, a good near term historic levels
Fundamentally net cash company with excellent return ratios
Promoters structure better than APL group


Ratnamani Target 1200+++CMP 816Ratnamani after breakout consolidating buy cmp next Target 1200+++ SL 804 Holding Duration 1 year
Ratnamani Metals bags export order worth $22.14 million
