SUNTECH REALITY IS READY FOR BOOMsuntech realty is big upside expect when it close above 521 in monthly
but it take a too long time to achieve the final target so wait and watch what happen
SUNTECK trade ideas

💥Sunteck Reality💥-Nice Breakout💥Sunteck Reality💥-Nice Breakout
Capital to be deployed- 20k
Investing Price-485-490
Breakout Price-481
Stoploss-380
Targets-642-1017
RT for max reach
#sunteckreality #stockstowatch #StocksToBuy #StocksInFocus #stocks #StockMarket

Strength Gaining Stock! #SUNTECKStrength Gaining Stock!
Sunteck Realty Ltd #SUNTECK
1. Rising with Volume
2. Cup and Handle
3. Rising above Volume Profile
Keep on your Screener.

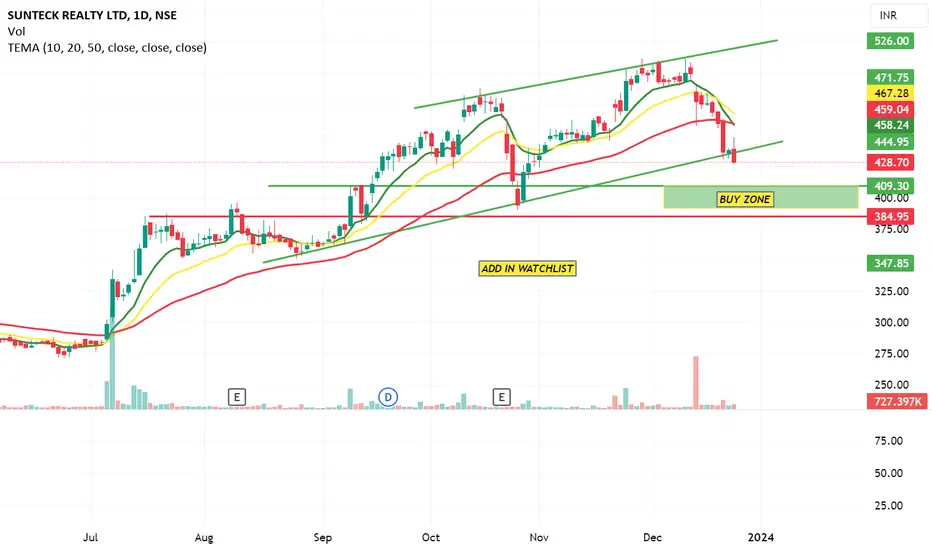
Sunteck Realty Technical AnalysisI have used the Smart money concept and simple TA
Double Bottom (Adam and Eve) has been identified
Price will retest between 315-320
The green box indicates the supply area from September 2020
Plus the price has kissed the 200 DMA
DRAWBACk : PE ratio high

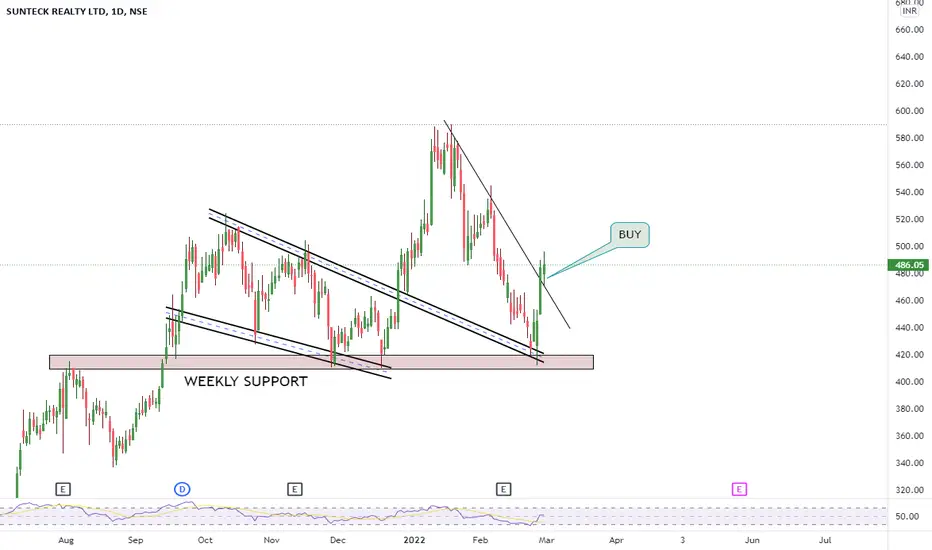
Double bottom, Inverse H&S in SUNTECKHi,
Greetings of the day!
One of the looked up sector to invest in Indian market is the real estate sector. One of the leaders in this segment under small cap universe is Sunteck realty ltd. Real estate sector is on revival after almost 10-15 years in India.
Technically, the chart has formed double bottom on daily chart and is consolidating near breakout region . This can be considered a bit early entry because the volumes say everything on charts. The script also shows formation of inverse head and shoulders after decent correction from 590 levels
based on Fibonacci levels the script can show levels of 450 560 first.
Based on the height of the head, levels of 550 can be visible
The risk reward is favourable where stop loss can be anywhere below 340 levels on weekly closing basis.
Note: the chart shared here is having logarithmic scale.
***As we have strict guidelines, the shared idea is just for learning on how to read & analyse charts and not recommendations of any sorts. Take it with pinch of salt :) ***
***If you like my analysis , then do follow me for more updates and like it so others can also benefit from this :) ****
Happy trading !

sunteck realtyThe company is focusing on building a rental portfolio from commercial projects. It has already preleased the entire project of Sunteck BCK51 at BKC Junction for lease tenure of 29 years. It is looking to pre-lease Sunteck Icon also at BKC Junction.
• The management plans to launch the new project at Kalyan along with new activation launch of towers in existing projects during the year.
• From FY18 to FY21 the company has delivered compounded annual growth rate (CAGR) in pre-sales of 21%. It expects to deliver pre-sales growth of ~20%-30% on compounded annual basis, going forward.
• At ODC, Goregaon the company has three launched projects i.e., Sunteck City Avenue 1, Avenue 2 and 4th Avenue and the balance inventory for the three projects together stands at ₹250 crore. Fromthe launched phases of Sunteck Naigaon i.e., Sunteck West World, Sunteck One World and Sunteck Maxx World the balance inventory to be sold stands at ~₹400 crore. Whereas for Vasai West, theinventory to be sold from the launched phase is ~₹600 crore.
• It will continue to target new acquisitions in the MMR (Mumbai Metropolitan Region) with focus on uber luxury segment and mid-income segment.

Double bottom Double bottom breakout pullback complete
Buy now
Stock had also broken long-term downtrend

Enter after CorrectionAs it broke long time trendline, and ready to blast. Also volume is also 23 times average volume.


SUNTECK REALTYHello and welcome to this analysis
In the monthly time frame it formed a Bearish Harmonic ABCD in JAN 2022 near 590 and since then has retraced 62% of its last leg.
In the weekly time frame it has formed a Bullish Harmonic Gartley around 315 suggesting the correction is most likely over.
It can be a good stock to accumulate between 330-370 for upside levels of 420-500-650. The view would be considered invalid below 285.
Good risk reward set up for medium to long term at the current level.
Happy Investing


Sunteck Reality Flag formation: Breakout possibleSome consolidation seen in suntech reality,
breakout possible from Flag pattern, Need to hold 495 levels for futher action.
Price Action suggest, all time high possible soon.

SUNTECK IH&SSUNTECK making inverse head and shoulder on weekly chart. strong during nifty fall. increasing volume on uptrend. RS line taking retest. excellent RR.

SUNTECKNSE:SUNTECK
please note that we are not a SEBI Registered Investor Adviser/PMS/ Broking House.
All the contents over here are for educational purposes only and are not investment advice or recommendations
offered to any person(s) with respect to the purchase or sale of the stocks / futures and options.
You are also requested to apply your prudence and consult your advisers in case you choose to act on
any such content available as WE claims no responsibilities for any of your actions or any outcome of
such action
Buy Sunteck RealtyBuy Sunteck
Tgt: 520,580
SL: 440
SUNTECK trading above 20,50,100,200 EMA on daily chart

Suntek Coming to SupportLooking for price action confirmation, before going for swing. Bearish divergence is there so give it time and set an alert, putting it in my watchlist. #short-to-Mid Term Swing Stock.

Sunteck realty positional viewThe stock of Sunteck realty has recently given strong breakout from its ATH levels of around 535.
It has given a retest of the breakout level and currently consolidating from past few days.
We can see a fresh upmove above 590-595 levels.Also, stock can be accumalated at current price and added on dips upto 535 as Realty sector is expected to perform good in the next 2-3 years
This is just for educational purposes and my personal view based on technical analysis.

SUNTECK shorting possibility for intraday.NSE:SUNTECK
The video is self-explanatory.
Looking good for 3-4% shorting position with a risk of 1-2%.


SUNTECK Realty Weekly H&S BreakoutNSE:SUNTECK has given a weekly breakout from a very long H&S pattern. Though right shoulder is much smaller compared to left one, asymmetrical shoulders aren't uncommon. Volume looks decent and weekly breakout candle also looks nice. As per classic TA, projection for this move would be to around 900 level (yes, that's a pretty large move). Let's see if it pans out. Keep an eye!

Sunteck Reality create a bullish head & shoulder chart patternFriends, Sunteck reality create a bullish head and shoulder chart pattern on weekly chart. Its looking very bullish for long term prospective currect stock traded on 570. My target is 900 and stop loss is 525. Please note this is only for educational purposes.

SUNTEK NSE BULLISHVIEW ABOVE 530SUNTEK NSE Suntek Reltay is bullish if 530 holds. New Lifetime High. Fresh MultiYear Breakout. Positive Trend.
***** Educational Purpose Only. Not Buy/Sell Recommendation.
