Tejas Networks Ltd – A Golden Opportunity After 57% Correction! 📖 Detailed Description & Analysis:
Tejas Networks, a leader in the telecom and network solutions space, witnessed a major correction of around 57% from its all-time high of ₹1,495, recently hitting a low of ₹650.
After sweeping the monthly low (a strong technical sign of liquidity grab), the stock created a higher high formation on the chart — a clear indication that buyers are stepping back in.
However, today, due to Q4 results, the stock dropped sharply by around 10.5%, now trading near ₹770.
👉 Important: Such results-driven drops are often short-lived if the overall technical structure is strong — and here, it is offering a golden buying opportunity for those who understand price action deeply.
Stock Overview:
All-Time High: ₹1,495
Recent Low: ₹650
Correction from Top: ~57%
📍 Entry Strategy:
Best Buying Zone: ₹689 – ₹645 (Ideal for better Risk-Reward)
Aggressive Players: Can start partial buying at current levels (around ₹770) with a proper stop-loss.
🛡️ Stop-Loss:
If price closes below the recent low (₹650) — exit the trade.
(This would mean price creating a fresh new low.)
🎯 Profit Targets:
Target 1: ₹870
Target 2: ₹975
Target 3: ₹1,150
👉 Short-term to Medium-term positional players can look to ride the move with partial profit booking at each target!
📈 Technical Highlights:
✅ Strong Higher High formation after major correction
✅ Tapped and bounced from the monthly demand zone
✅ Risk-Reward setup looking extremely favorable
✅ The 10% drop is not structural weakness — but a temporary reaction to earnings.
📢 Don’t Miss Out!
✅ Make sure to follow me so you don’t miss my next analysis!
👍 Drop a like if you found this helpful and leave a comment with your thoughts!
💬 Let’s chat in the comment section. See you there! 🚀📊
Thanks for your support! 🙏
⚡ Key Reminder:
Always use proper position sizing and risk management. No trade is guaranteed — but following the right setups consistently gives you the winning edge! 🧠💥
TEJASNET trade ideas

50 SMA Rising- Positional TradeDisclaimer: I am not a Sebi registered adviser.
This Idea is publish purely for educational purpose only before investing in any stocks please take advise from your financial adviser.
Its 50 SMA Rising Strategy. Suitable for Positional Trading Initial Stop loss lowest of last 2 candles and keep trailing with 50 days SMA if price close below 50 SMA then Exit or be in the trade some time trade can go for several months.
Be Discipline because discipline is the Key to Success in the STOCK Market.
Trade What you see not what you Think

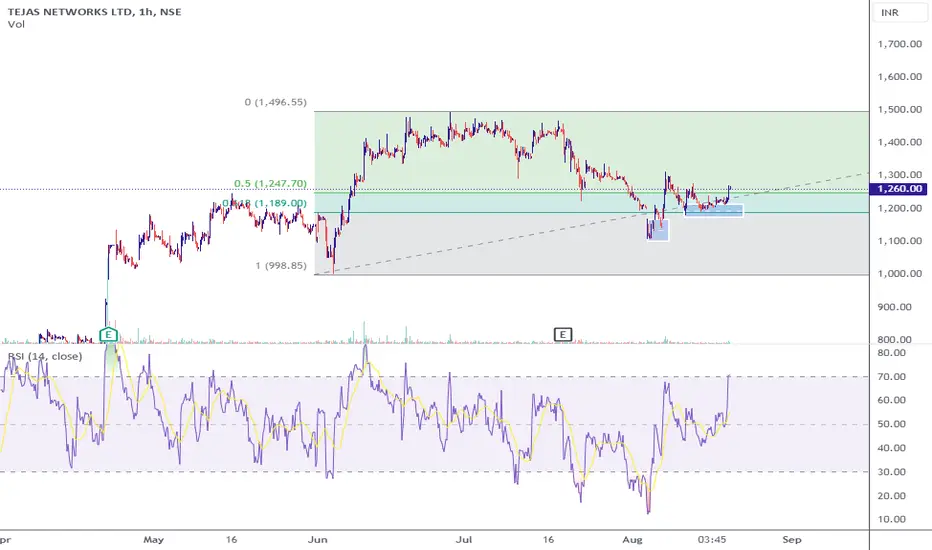
Tejas Networks Ltd 1. **Support and Resistance Levels:**
- **Resistance** is marked around ₹1,427.10.
- **Current price** appears to be around ₹1,326.95, with the next potential move targeting higher levels.
2. **Chart Patterns:**
- A **symmetrical triangle** or consolidation pattern is evident, suggesting a breakout attempt, which may already have occurred as the price is moving upward.
3. **Target and Stop-Loss:**
- **Target:** ₹1,470.65 (approximately 10% gain).
- **Stop-Loss:** ₹1,276 (1% downside risk).
- This indicates a **Risk/Reward Ratio** of 10.06, which is excellent.
4. **Indicators:**
- The use of a **moving average** line indicates support in the upward trend.
- Fibonacci levels or historical price actions may have been used to calculate the target.

Tejas Network ? Can it give profits ?Good fundamentals, Great stakeholders, Overall discounted market, Stock near least resistant line. Odds are more that we make money on this trade.

TEJAS NETWORK Volume spike cmp : 1187
sl : 1100 cb
t1 : 1370
t2 : 1500
Market Cap
₹ 20,341 Cr.
Current Price
₹ 1,188
High / Low
₹ 1,495 / 651
Stock P/E
44.8
Book Value
₹ 217
Dividend Yield
0.00 %
ROCE
3.68 %
ROE
2.06 %
Face Value
₹ 10.0
Add ratio to table

Tejasnet - Good Things are happening here. 📊 TEJASNET Weekly Chart Update
The chart is pretty self-explanatory as always, but here are some key observations worth noting:
1. 📈 The stock was in a mad uptrend throughout most of 2024, rallying to ₹1,500.
2. 🔄 After that, it entered a pullback phase and has been consolidating since.
3. 📉 We're currently sitting at a crucial multiple support zone, which has held firm so far.
4. You can now access our structured charts for all Nifty 500 companies. Check the signature column below for more info.
5. 🔎 The last two weekly candles are indecisive doji candles with long lower wicks – signaling potential buyer interest.
6. 📊 Volume was excellent last week, suggesting there could be strong buying pressure building up.
7. 💼 Q2 results are out and IMO, they’re perfect – reinforcing the bullish sentiment.
All these factors combined make TEJASNET a must-have on your watchlist! 👀
Disclaimer: This analysis is for educational purposes only and should not be considered as financial advice. All investments carry risk, and it’s important to conduct your own research or consult with a certified financial advisor before making any investment decisions. I do not provide buy, sell, or hold recommendations. Past performance is not indicative of future results.

Tejas Networks Just started to trade above discount Zone !Tejas Networks Just started to trade above discount Zone and getting support at demand zones .
Tejas Networks Posts Strong Q1, Awaiting BreakoutTEJAS NETWORKS reports strong Q1 results with significant net profit, substantial revenue increase, and solid EBITDA profit. Technically, the stock is consolidating after an uptrend, retracing from the 38% Fibonacci level, and is poised for a breakout above 1495 INR.

Tejasnet flying Supersonic 6G speed :) :) :)Comparison of Quarterly and Daily Timeframes of Tejasnet shows amazing structures for bigger targets
On Quarterly Chart - there is an amazing structure around 670-675 levels
4 Critical Confluences meeting at 1 single point providing the Price an Amazing Boost
1. Long Term Cup & Handle Trendline from 2018 crossing
2. Parallel Channel from 2021 crossing
3. Flag pattern bottom criss-crossing
4. Fib 0.618 level precisely meeting the intersection point of all above (1-3)
When you have some exceptional scenarios - its impossible to go Bearish. Don't even think twice to take an entry at such levels
Price completed 3 out of 4 targets already given. Next Target 1360
On Daily Chart - Price is on the verge of Fresh Rounding Bottom BO
If sustained above 1250 WCB (preferably today), then Target would be 1490
We took entry at this stock around 460 levels and holding with 170% profits :) :) :) and more to go
Disclaimer:
Stocks-n-Trends is NOT registered with SEBI. We do not provide Buy / Sell recommendations - rather we provide detailed analysis of how to review a chart, explain multi-timeframe views purely for Educational Purposes. We strongly suggest our followers to "Learn to Ride the Tide" and consult your Financial Advisors before taking any positions.
If you like our detailed analysis, please do rate us with your Likes, Boost and share your comments
-Team Stocks-n-Trends

TEJAS NETWOK Short term buy cmp 890 Tejas Network – Company partnering with FIbreConnect to deploy optical network in Italy.
Impact - Positive
Expecting 16% Upside movement positionally ( Rs 990 ) cmp 890
Entry can be done in support area 847 - 856


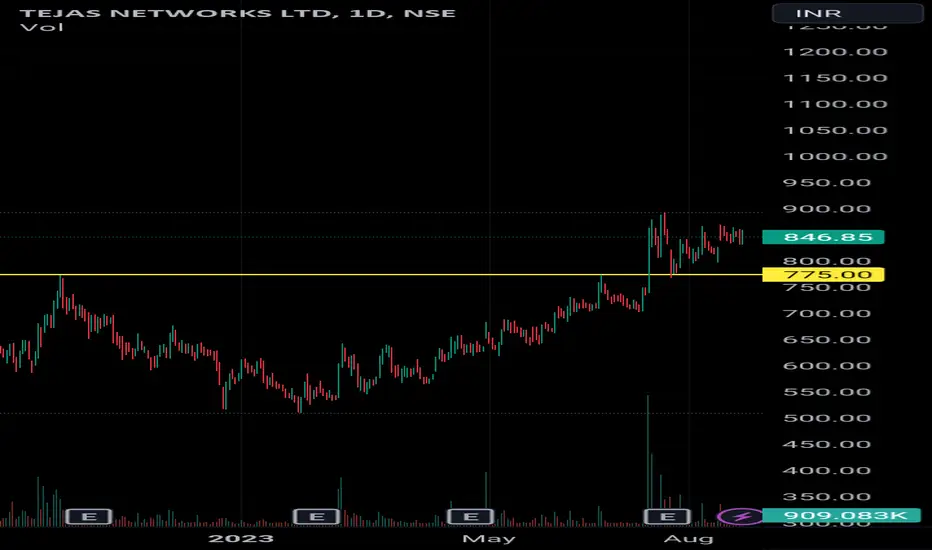
TEJAS NETWORK LTDTEJAS NETWORK LTD (1D)
CMP 846.85
Stock given breakout with big volume and consolidating in a higher Range
After breakout price has retested previous Resistance
One can look for more upside
Tejasnet - New All Time High ?Certainly, here's a more informative version of your statement:
"The breakout of the cup and handle pattern has already taken place, marking a significant technical development in the price chart. This pattern's completion implies a potential upcoming surge in prices, potentially leading to the establishment of a new all-time high. This conjecture is further supported by the current Relative Strength Index (RSI) reading, which indicates a robust level of price strength and positive momentum in the market.
Note:- this information is shared solely for educational purposes and is not intended as financial advice."

TEJASNET Ascending Triangle Pattern FormationTEJASNET can be seen forming higher lows with a consolidating top on a daily range. Interesting to see if it can break its all time high resistance and achieve 900 levels after a breakout.

TEJAS NETWORKS : LongTejas network has broken the cup and handle and met the first target and is approaching to second and third targets.
Entry: 874
Not a good risk reward
First target: 925
First Stoploss: 794
Good risk reward
Second target: 1024
Second Stoploss: 725

Very Strong Stock! #TEJASNETVery Strong Stock!
Tejas Networks Ltd. #TEJASNET
1- Higher High Pattern
2- Triangle Breakout
3- Highest Weekly Volume
Note: Technical Analysis is for Educational Purpose. I am not SEBI registered. Consult your financial advisor for any Investment Advice.

Channel BreakoutPlease look into the chart for a detailed understanding.
Consider these for short-term & swing trades with 2% profit.
For BTST trades consider booking
target for 1% - 2%
For long-term trades look out for resistance drawn above closing.
Please consider these ideas for educational purpose
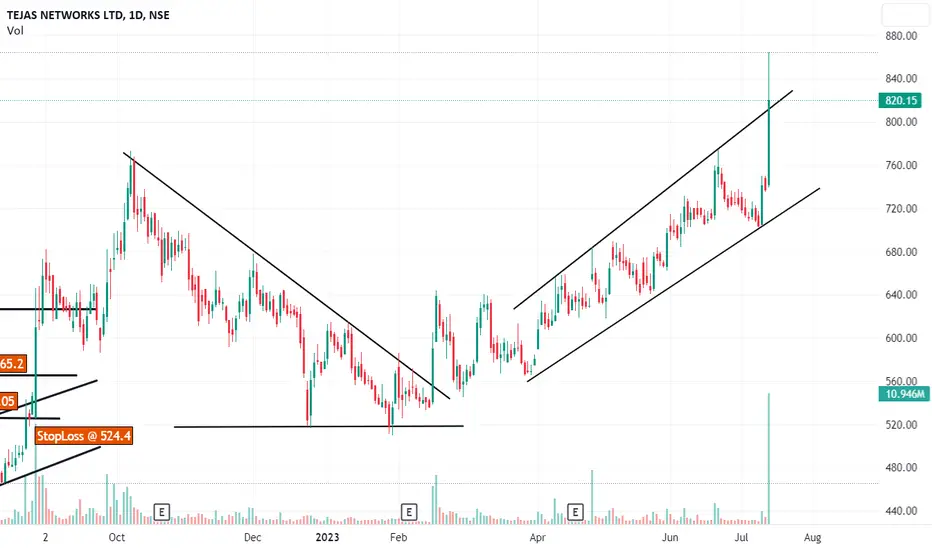
Tejas Network-Nice BreakoutTejas Network-Nice Breakout
Capital to be deployed- 20k
Investing Price -810-820
Breakout Price -805
Stoploss -691
Targets -1239-1874
#Tejas #stockmarkets #StocksToBuy #StocksInFocus #StocksToTrade

Inside bar + Trend line support in DInside bar Support + Trend line support
Bullish
MTM: 575
Target: 638
SL: 554

1st target 571 2nd 495In chart losing strength so go for short of target 571 as its 1st support several time take support if not take take support 571 then 2nd target 495

TEJAS NETWORKCan go for a buy-in Tejas network if it breaks above 645, target for 750.
for educational purposes.

TEJAS NETWORK - RAJDHANI SPEED COMINGWeekly Breakout...Nothing much to add here can see 800 900 levels in medium term...Add on DIPS 560 580 good levels to add

Tejas Networks Rounding Pattern Formation Lifetime High Breakout*Tejas Networks*
Time Frame: Daily
Observation:
* Rounding Bottom Pattern Formation on Daily time frame.
* Lifetime high tested.
Resistance/Target: 690 756 820 861
Support: 570 526 467
